A quick and dirty way to show colours in a plot.
show_col(colours, labels = TRUE, borders = NULL, cex_label = 1, ncol = NULL)Arguments
- colours
A character vector of colours
- labels
Label each colour with its hex name?
- borders
Border colour for each tile. Default uses
par("fg"). Useborder = NAto omit borders.- cex_label
Size of printed labels, as multiplier of default size.
- ncol
Number of columns. If not supplied, tries to be as square as possible.
Examples
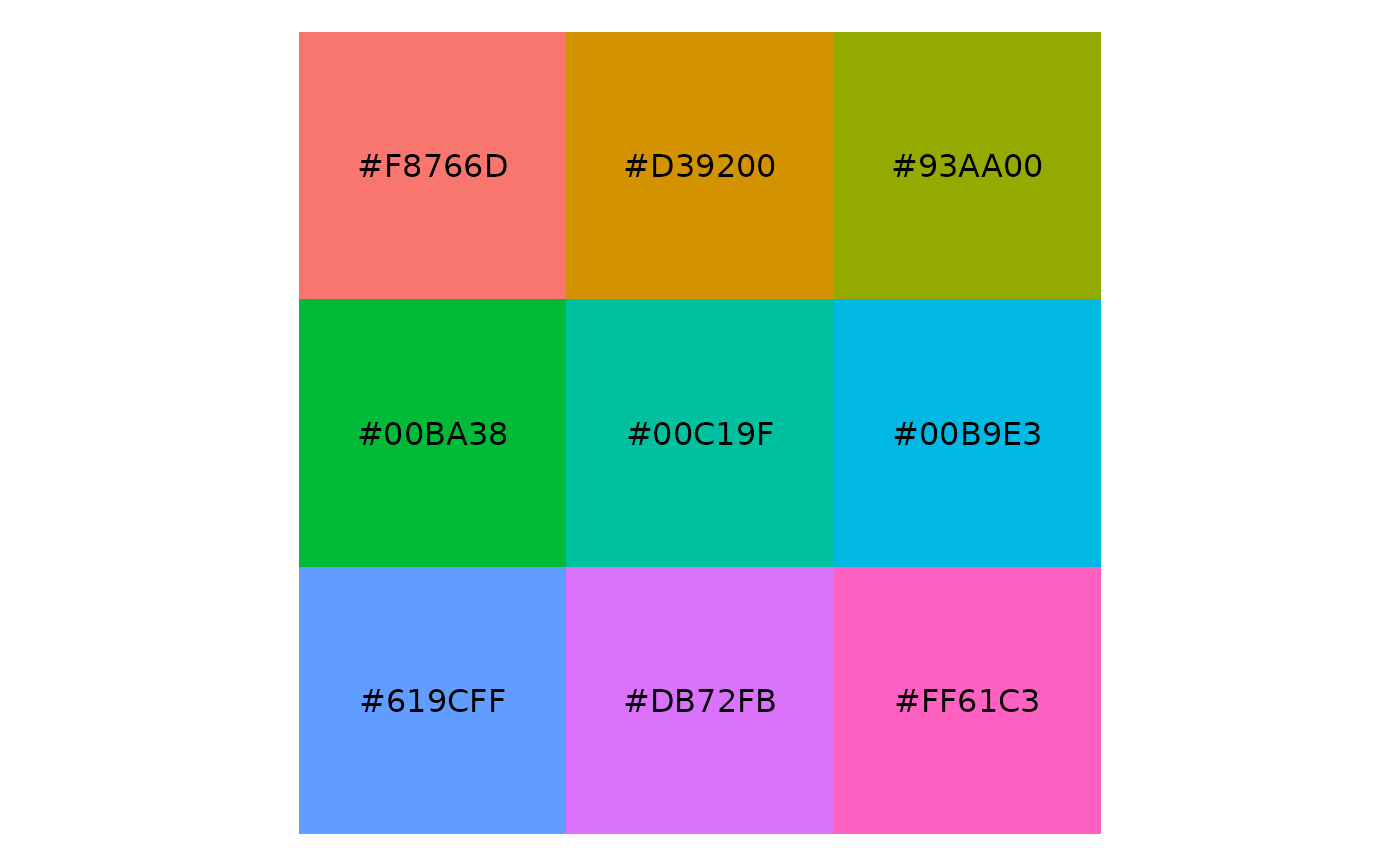
show_col(pal_hue()(9))
 show_col(pal_hue()(9), borders = NA)
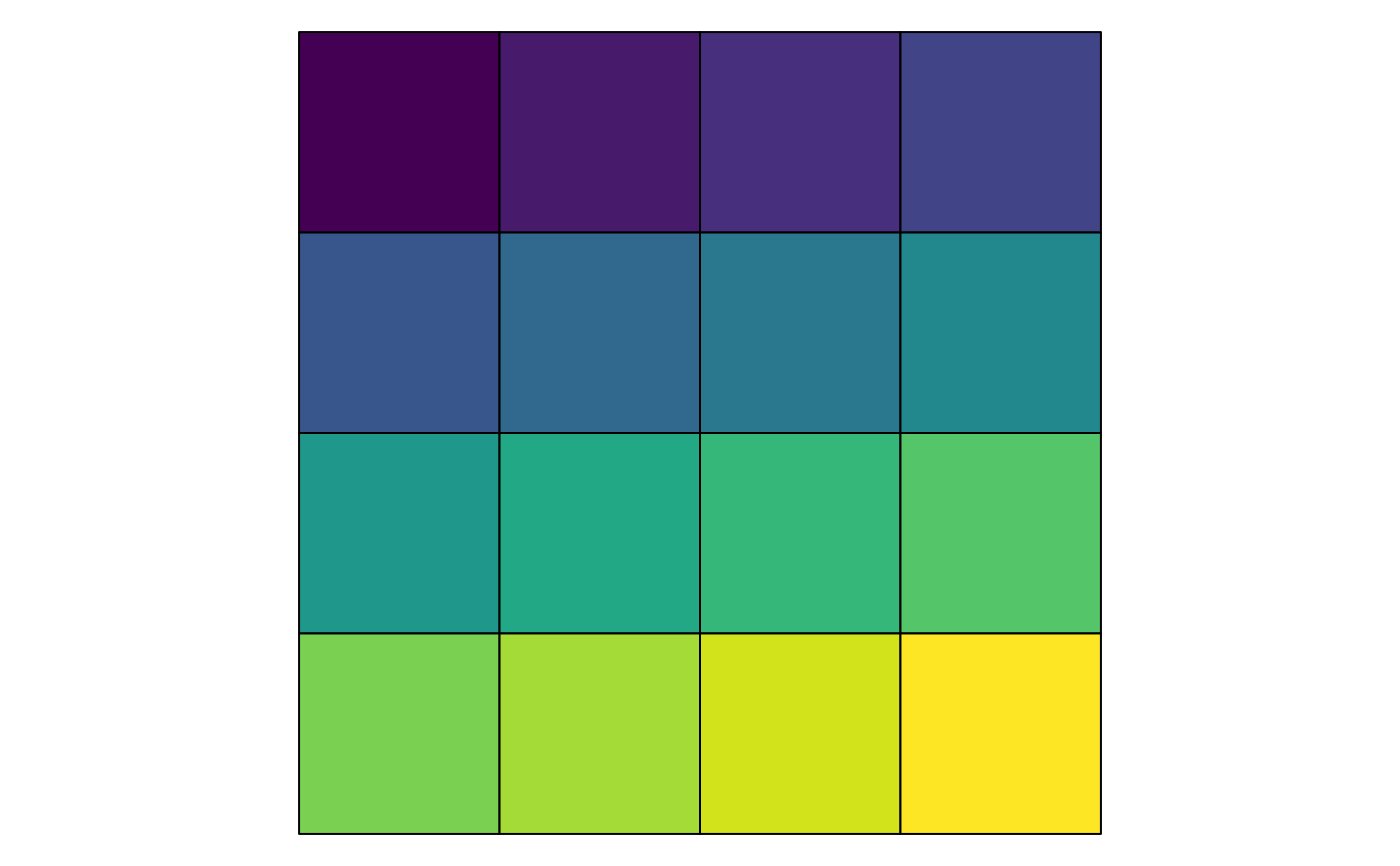
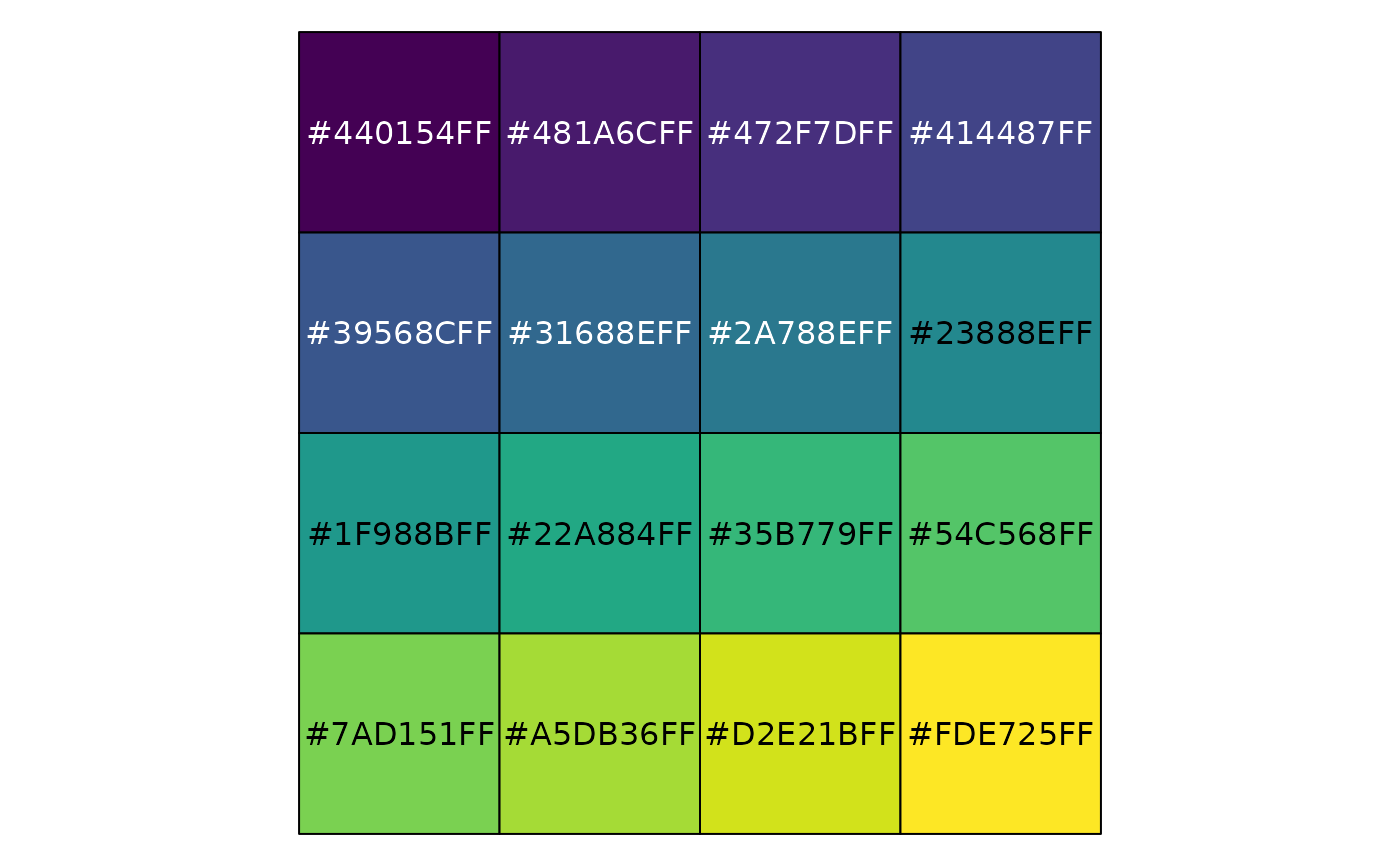
 show_col(pal_viridis()(16))
 show_col(pal_viridis()(16), labels = FALSE)