The plot() method for the performance::check_dag() function.
# S3 method for class 'see_check_dag'
plot(
  x,
  size_point = 20,
  size_text = 4.5,
  colors = NULL,
  which = "all",
  effect = "total",
  check_colliders = TRUE,
  ...
)
Arguments
- x
A
check_dagobject.- size_point
Numeric value specifying size of point geoms.
- size_text
Numeric value specifying size of text elements.
- colors
Character vector of length five, indicating the colors (in hex-format) for different types of variables, which are assigned in following order:
outcome,exposure,adjusted,unadjusted, andcollider.- which
Character string indicating which plot to show. Can be either
"all","current"or"required".- effect
Character string indicating which effect for the required model is to be estimated. Can be either
"total"or"direct".- check_colliders
Logical indicating whether to highlight colliders. Set to
FALSEif the algorithm to detect colliders is very slow.- ...
Currently not used.
Value
A ggplot2-object.
Examples
library(performance)
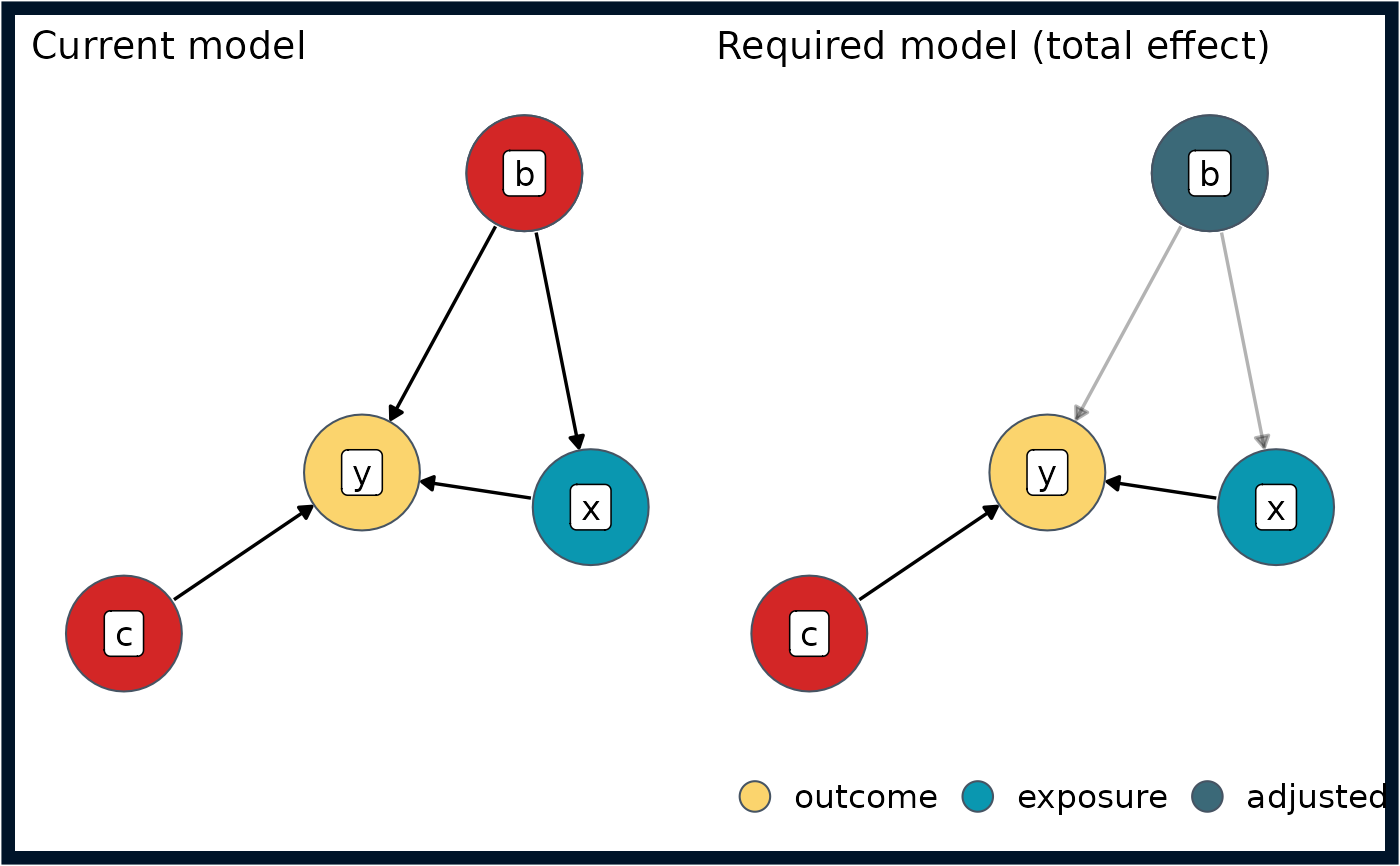
# incorrect adjustment
dag <- check_dag(
y ~ x + b + c,
x ~ b,
outcome = "y",
exposure = "x"
)
dag
#> # Check for correct adjustment sets
#> - Outcome: y
#> - Exposure: x
#>
#> Identification of direct and total effects
#>
#> Incorrectly adjusted!
#> To estimate the direct and total effect, at least adjust for `b`. Currently, the model does not adjust for any variables.
#>
plot(dag)
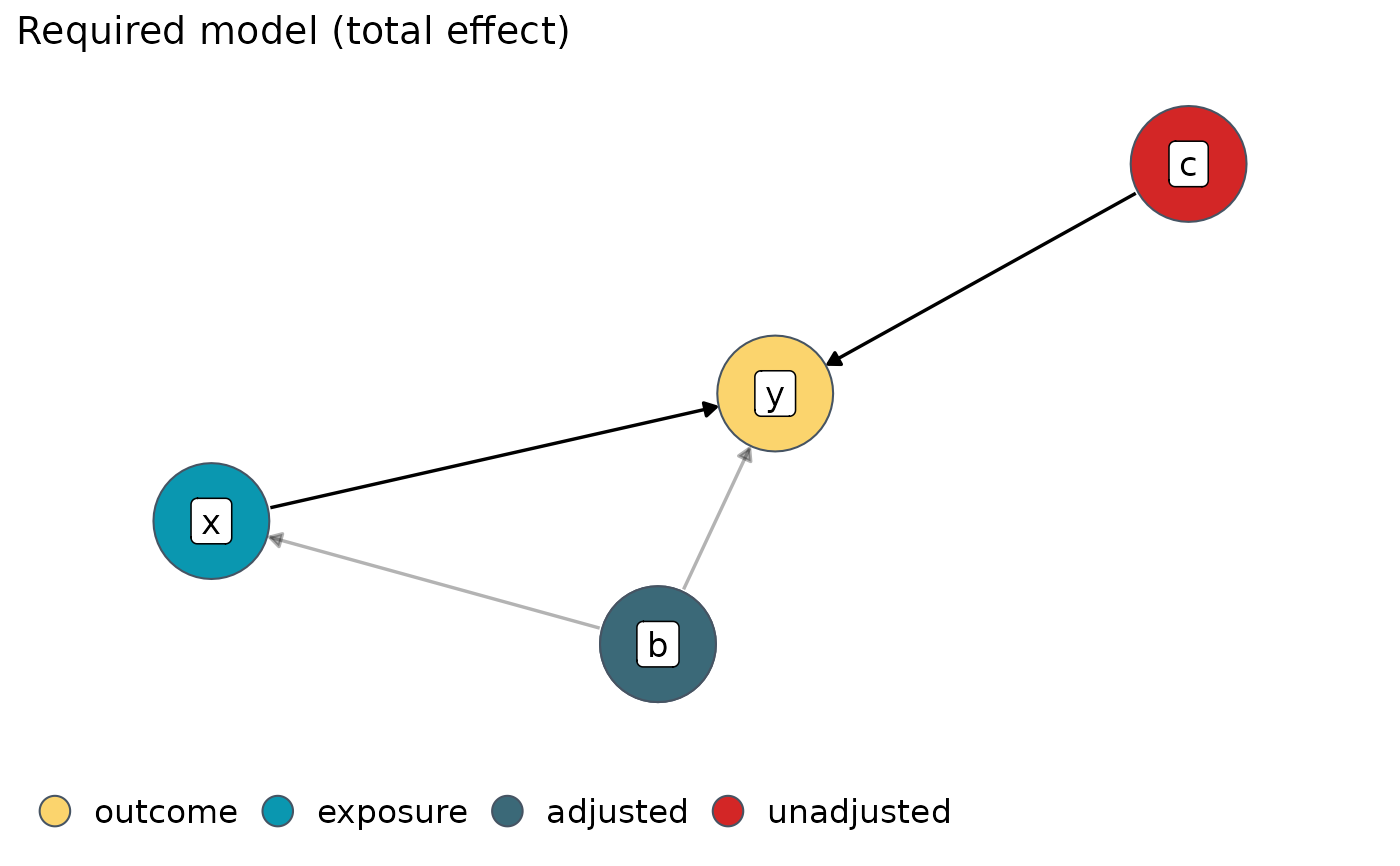
 # plot only model with required adjustments
plot(dag, which = "required")
# plot only model with required adjustments
plot(dag, which = "required")
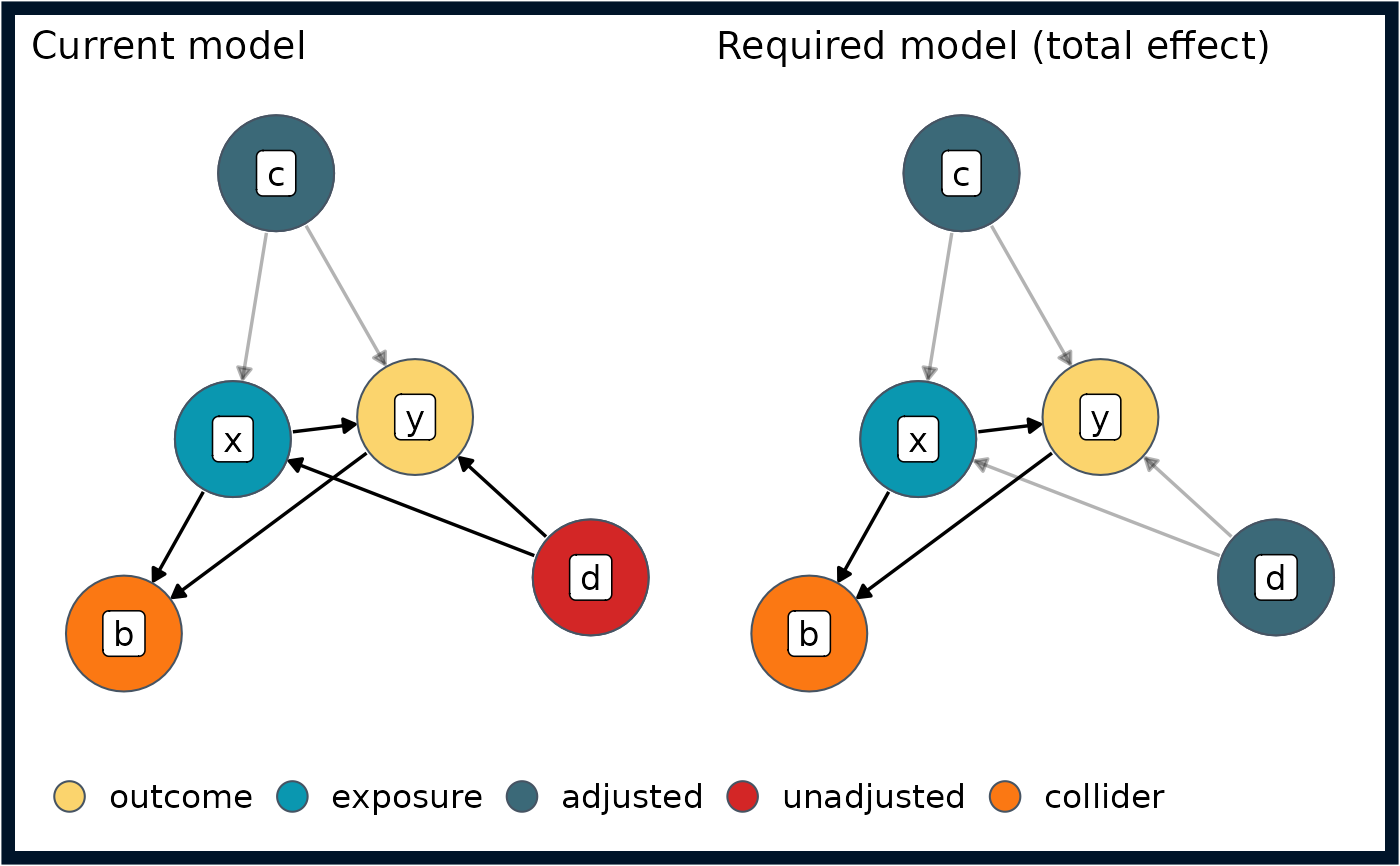
 # collider-bias?
dag <- check_dag(
y ~ x + c + d,
x ~ c + d,
b ~ x,
b ~ y,
outcome = "y",
exposure = "x",
adjusted = "c"
)
plot(dag)
# collider-bias?
dag <- check_dag(
y ~ x + c + d,
x ~ c + d,
b ~ x,
b ~ y,
outcome = "y",
exposure = "x",
adjusted = "c"
)
plot(dag)
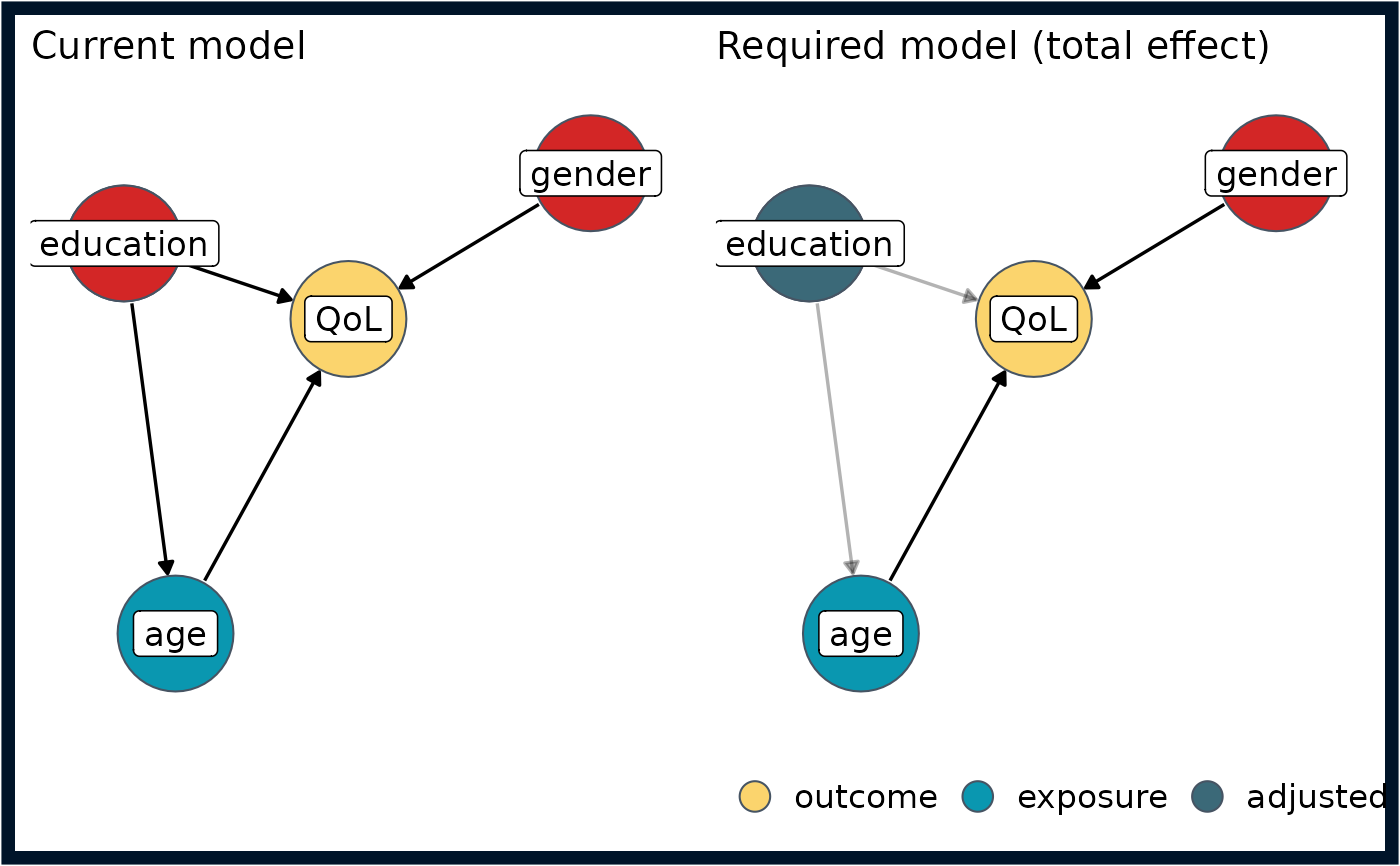
 # longer labels, automatic detection of outcome and exposure
dag <- check_dag(
QoL ~ age + education + gender,
age ~ education
)
plot(dag)
# longer labels, automatic detection of outcome and exposure
dag <- check_dag(
QoL ~ age + education + gender,
age ~ education
)
plot(dag)