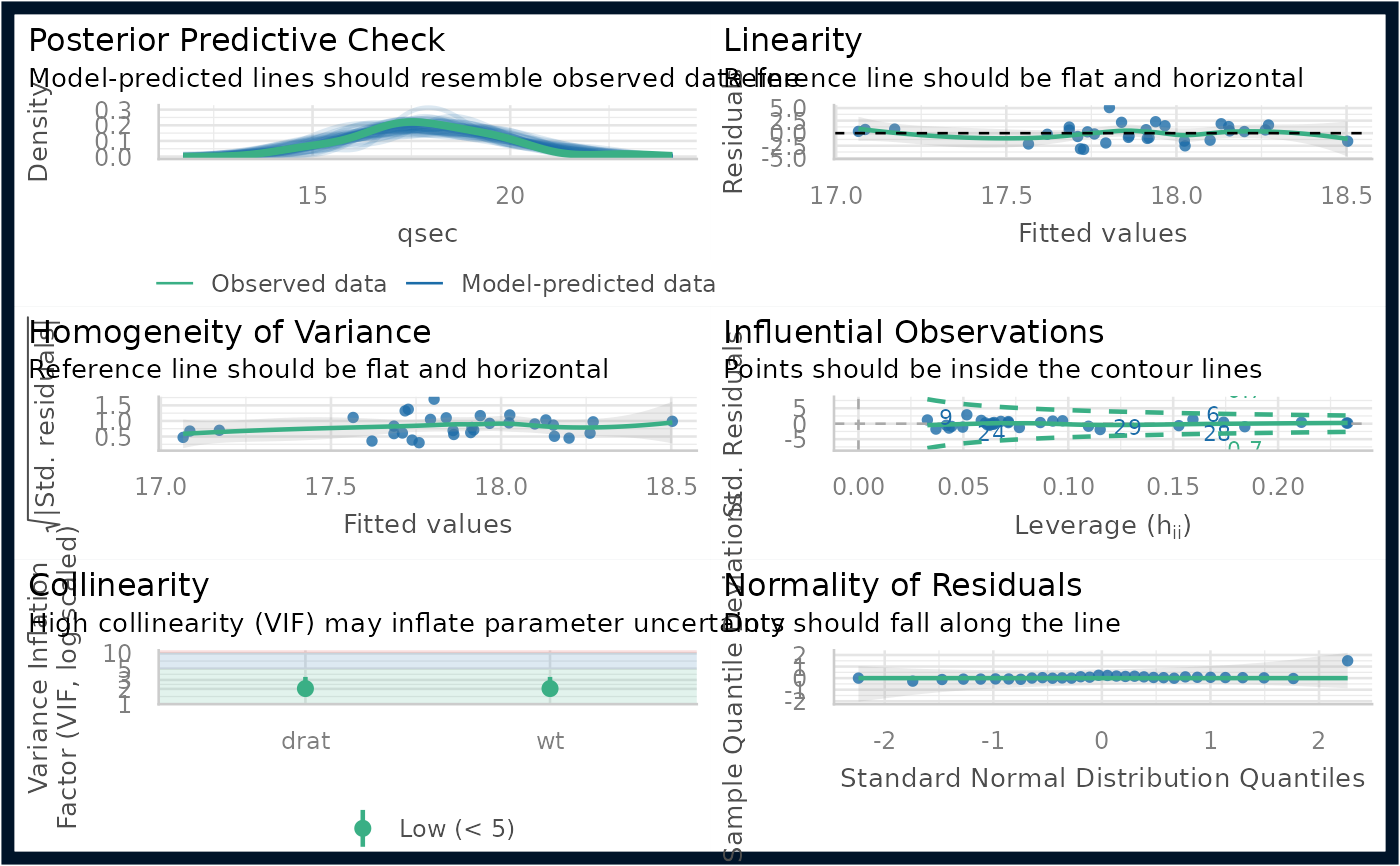
The plot() method for the performance::check_model() function.
Diagnostic plots for regression models.
Arguments
- x
An object.
- style
A ggplot2-theme.
- colors
Character vector of length two, indicating the colors (in hex-format) for points and line.
- type
Plot type for the posterior predictive checks plot. Can be
"density"(default),"discrete_dots","discrete_interval"or"discrete_both"(thediscrete_*options are appropriate for models with discrete - binary, integer or ordinal etc. - outcomes).- n_columns
Number of columns to align plots.
- ...
Arguments passed to or from other methods.
Value
A ggplot2-object.
See also
See also the vignette about check_model().
Examples
library(performance)

model <- lm(qsec ~ drat + wt, data = mtcars)
plot(check_model(model))
#> Ignoring unknown labels:
#> • size : ""