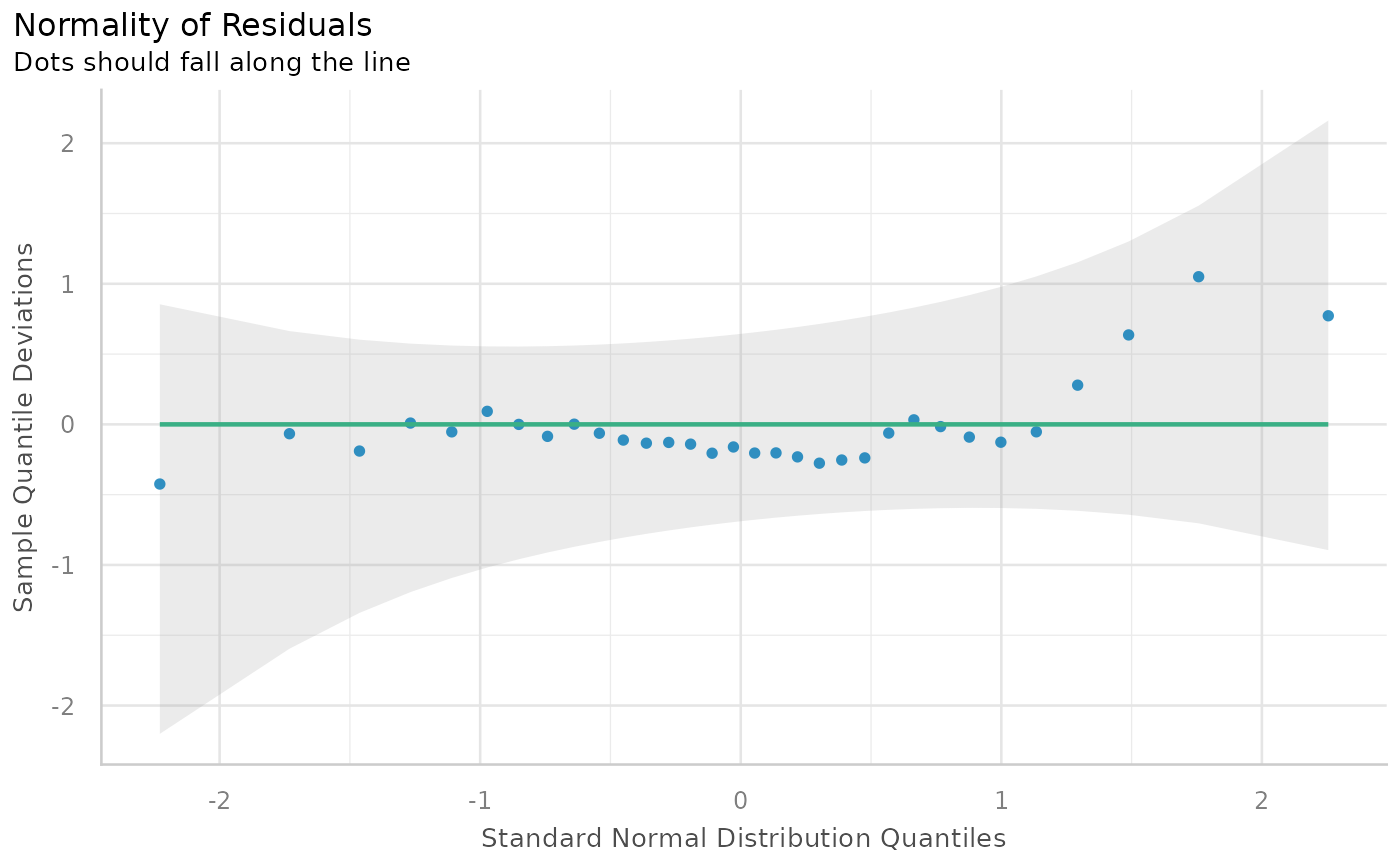
Plot method for check model for (non-)normality of residuals
Source:R/plot.check_normality.R
plot.see_check_normality.RdThe plot() method for the performance::check_normality()
function.
Arguments
- x
An object.
- type
Character vector, indicating the type of plot. Options are
"qq"(default) for quantile-quantile (Q-Q) plots,"pp"for probability-probability (P-P) plots, or"density"for density overlay plots.- data
The original data used to create this object. Can be a statistical model.
- linewidth
Numeric value specifying size of line geoms.
- size_point
Numeric specifying size of point-geoms.
- base_size, size_axis_title, size_title
Numeric value specifying size of axis and plot titles.
- alpha
Numeric value specifying alpha level of the confidence bands.
- alpha_dot
Numeric value specifying alpha level of the point geoms.
- colors
Character vector of length two, indicating the colors (in hex-format) for points and line.
- detrend
Logical that decides if Q-Q and P-P plots should be de-trended (also known as worm plots).
- method
The method used for estimating the qq/pp bands. Default to
"ell"(equal local levels / simultaneous testing - recommended). Can also be one of"pointwise"or"boot"for pointwise confidence bands, or"ks"or"ts"for simultaneous testing. Seeqqplotr::stat_qq_band()for details.- ...
Arguments passed to or from other methods.
Value
A ggplot2-object.
See also
See also the vignette about check_model().
Examples
library(performance)

m <<- lm(mpg ~ wt + cyl + gear + disp, data = mtcars)
result <- check_normality(m)
plot(result)


plot(result, type = "qq", detrend = TRUE)