Plot method for comparison of model parameters
Source:R/plot.compare_parameters.R
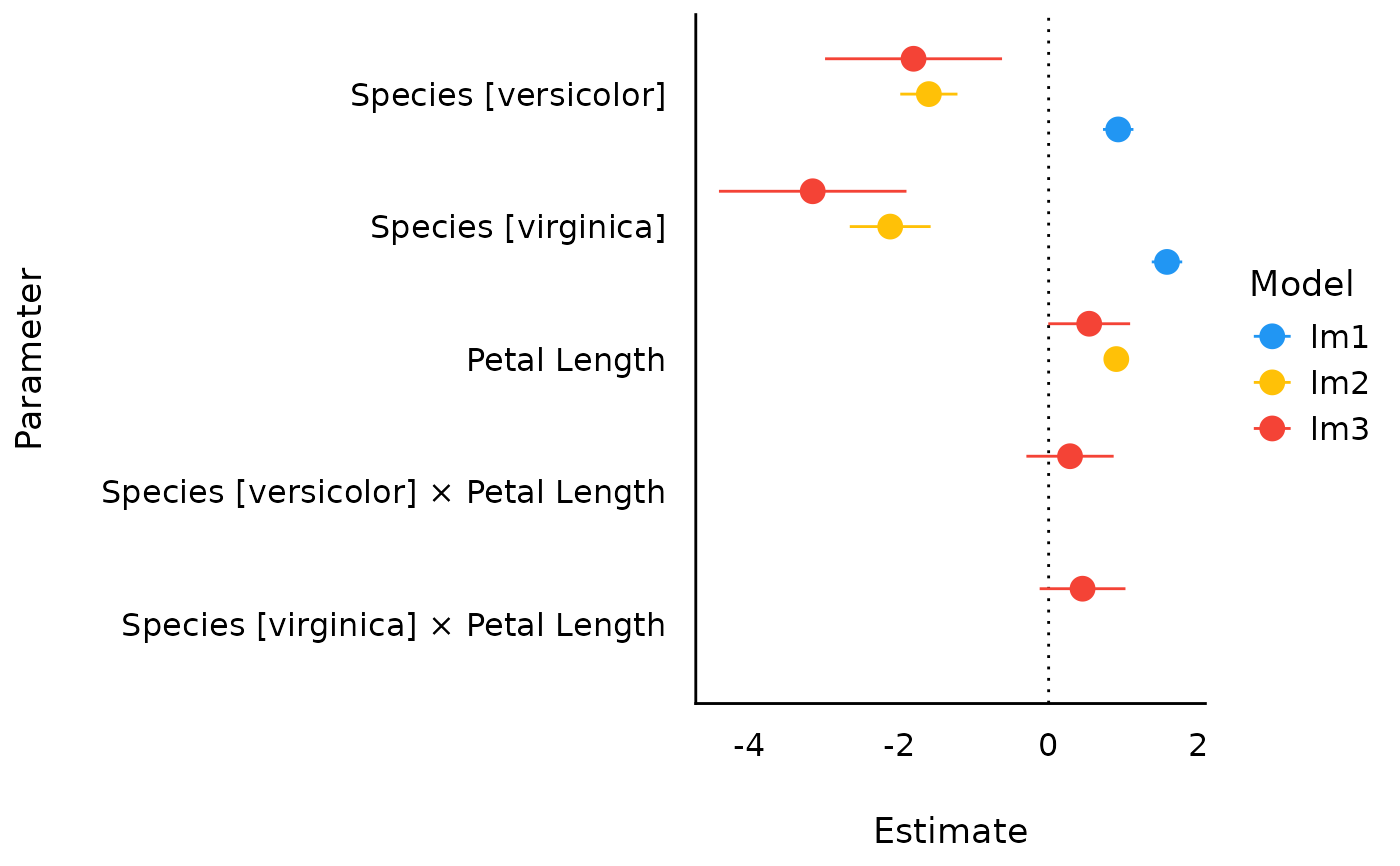
plot.see_compare_parameters.RdThe plot() method for the parameters::compare_parameters()
function.
# S3 method for class 'see_compare_parameters'
plot(
  x,
  show_intercept = FALSE,
  size_point = 0.8,
  size_text = NA,
  dodge_position = 0.8,
  sort = NULL,
  n_columns = NULL,
  show_labels = FALSE,
  ...
)
Arguments
- x
An object.
- show_intercept
Logical, if
TRUE, the intercept-parameter is included in the plot. By default, it is hidden because in many cases the intercept-parameter has a posterior distribution on a very different location, so density curves of posterior distributions for other parameters are hardly visible.- size_point
Numeric specifying size of point-geoms.
- size_text
Numeric value specifying size of text labels.
- dodge_position
Numeric value specifying the amount of "dodging" (spacing) between geoms.
- sort
The behavior of this argument depends on the plotting contexts.
Plotting model parameters: If
NULL, coefficients are plotted in the order as they appear in the summary. Settingsort = "ascending"orsort = "descending"sorts coefficients in ascending or descending order, respectively. Settingsort = TRUEis the same assort = "ascending".Plotting Bayes factors: Sort pie-slices by posterior probability (descending)?
- n_columns
For models with multiple components (like fixed and random, count and zero-inflated), defines the number of columns for the panel-layout. If
NULL, a single, integrated plot is shown.- show_labels
Logical. If
TRUE, text labels are displayed.- ...
Arguments passed to or from other methods.
Value
A ggplot2-object.