Plot method for plotting p-functions (aka consonance functions)
Source:R/plot.p_function.R
plot.see_p_function.RdThe plot() method for the parameters::p_function ().
Arguments
- x
An object returned by
parameters::p_function ().- colors
Character vector of length two, indicating the colors (in hex-format) used when only one parameter is plotted, resp. when panels are plotted as facets.
- size_point
Numeric specifying size of point-geoms.
- linewidth
Numeric value specifying size of line geoms.
- size_text
Numeric value specifying size of text labels.
- alpha_line
Numeric value specifying alpha of lines indicating the emphasized compatibility interval levels (see
?parameters::p_function).- show_labels
Logical. If
TRUE, text labels are displayed.- n_columns
For models with multiple components (like fixed and random, count and zero-inflated), defines the number of columns for the panel-layout. If
NULL, a single, integrated plot is shown.- show_intercept
Logical, if
TRUE, the intercept-parameter is included in the plot. By default, it is hidden because in many cases the intercept-parameter has a posterior distribution on a very different location, so density curves of posterior distributions for other parameters are hardly visible.- ...
Arguments passed to or from other methods.
Value
A ggplot2-object.
Examples
library(parameters)
#>
#> Attaching package: ‘parameters’
#> The following object is masked from ‘package:rstanarm’:
#>
#> compare_models
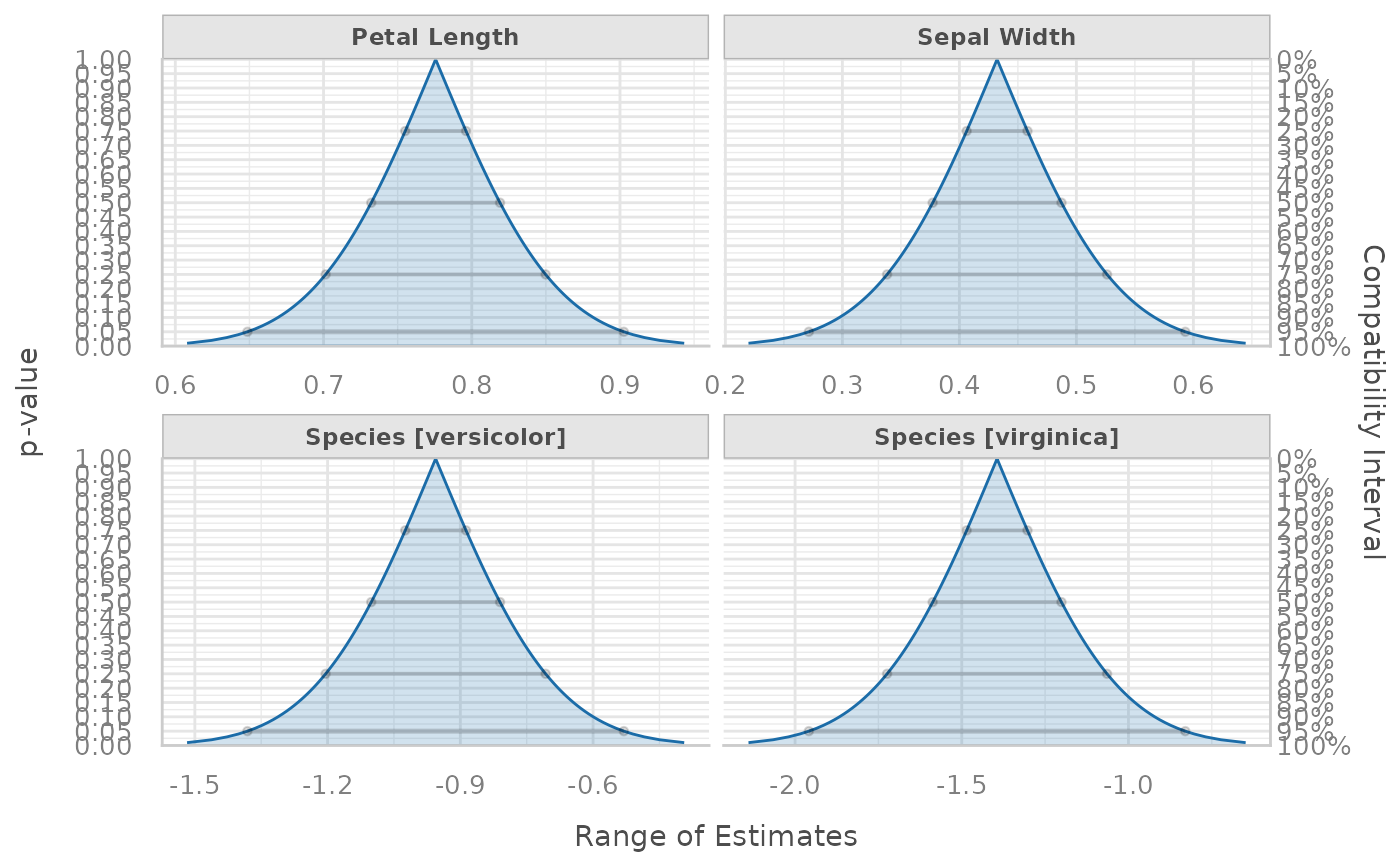
model <- lm(Sepal.Length ~ Species + Sepal.Width + Petal.Length, data = iris)
result <- p_function(model)
plot(result, n_columns = 2, show_labels = FALSE)
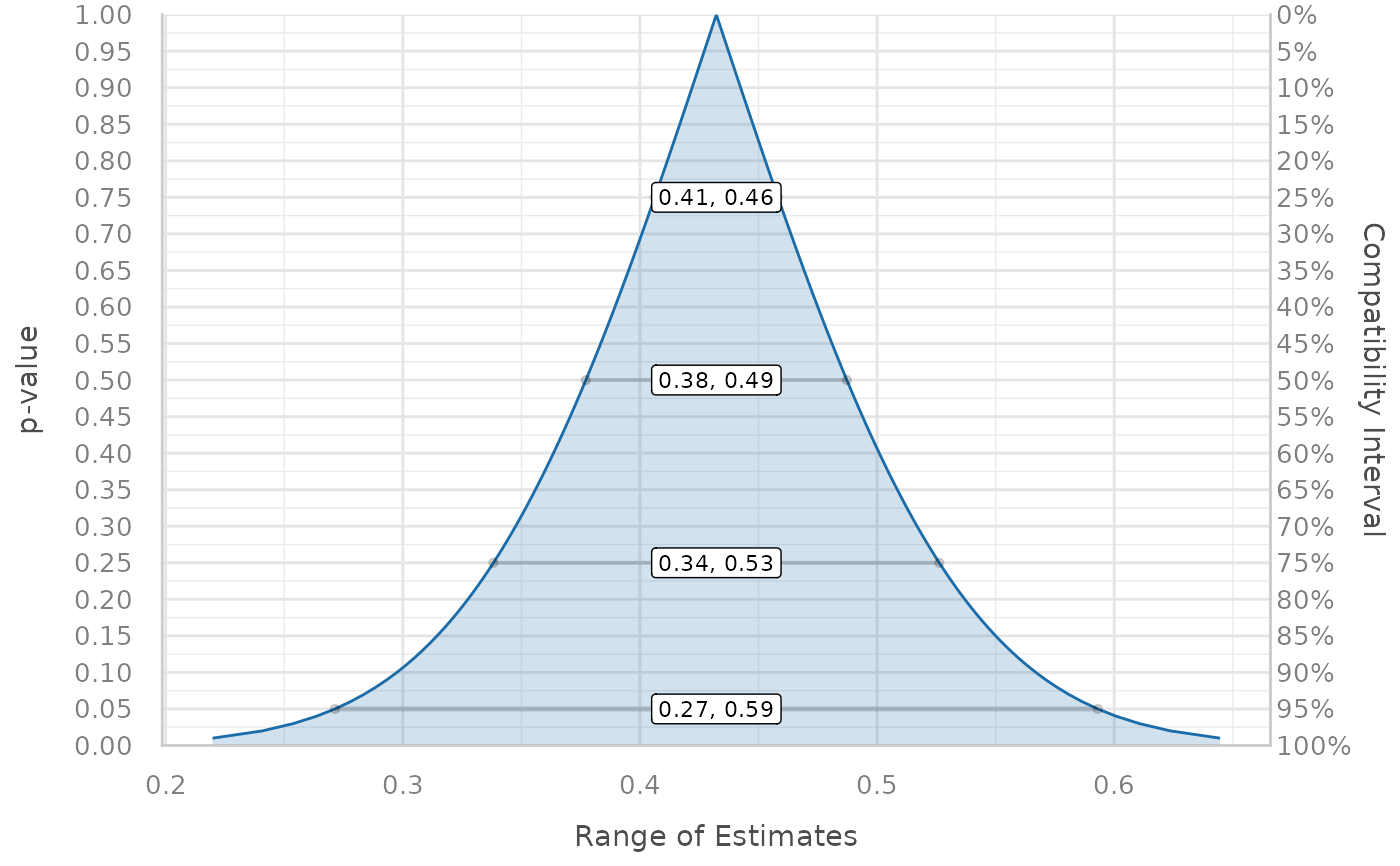
 result <- p_function(model, keep = "Sepal.Width")
plot(result)
result <- p_function(model, keep = "Sepal.Width")
plot(result)