A wrapper around patchwork to plot multiple figures side by side on the same page.
plots(
  ...,
  n_rows = NULL,
  n_columns = NULL,
  guides = NULL,
  tags = FALSE,
  tag_prefix = NULL,
  tag_suffix = NULL,
  tag_sep = NULL,
  title = NULL,
  subtitle = NULL,
  caption = NULL,
  theme = NULL
)
Arguments
- ...
Multiple
ggplots or a list containingggplotobjects- n_rows
Number of rows to align plots.
- n_columns
Number of columns to align plots.
- guides
A string specifying how guides should be treated in the layout.
'collect'will collect shared guides across plots, removing duplicates.'keep'will keep guides alongside their plot.'auto'will inherit from a higher patchwork level (if any). Seepatchwork::plot_layout()for details.Add tags to your subfigures. Can be
NULLto omit (default) or a character vector containing tags for each plot. Automatic tags can also be generated with'1'for Arabic numerals,'A'for uppercase Latin letters,'a'for lowercase Latin letters,'I'for uppercase Roman numerals, and'i'for lowercase Roman numerals. For backwards compatibility, can also beFALSE(equivalent toNULL),NA(equivalent toNULL), orTRUE(equivalent to'A').- tag_prefix, tag_suffix
Text strings that should appear before or after the tag.
- tag_sep
Text string giving the separator to use between different tag levels.
- title, subtitle, caption
Text strings to use for the various plot annotations to add to the composed patchwork.
- theme
A ggplot theme specification to use for the plot. Only elements related to titles, caption, and tags, as well as plot margin and background, are used.
Details
See the patchwork documentation for more advanced control of plot layouts.
Examples
library(ggplot2)
library(see)
p1 <- ggplot(mtcars, aes(x = disp, y = mpg)) +
geom_point()
p2 <- ggplot(mtcars, aes(x = mpg)) +
geom_density()
p3 <- ggplot(mtcars, aes(x = factor(cyl))) +
geom_bar() +
scale_x_discrete("cyl")
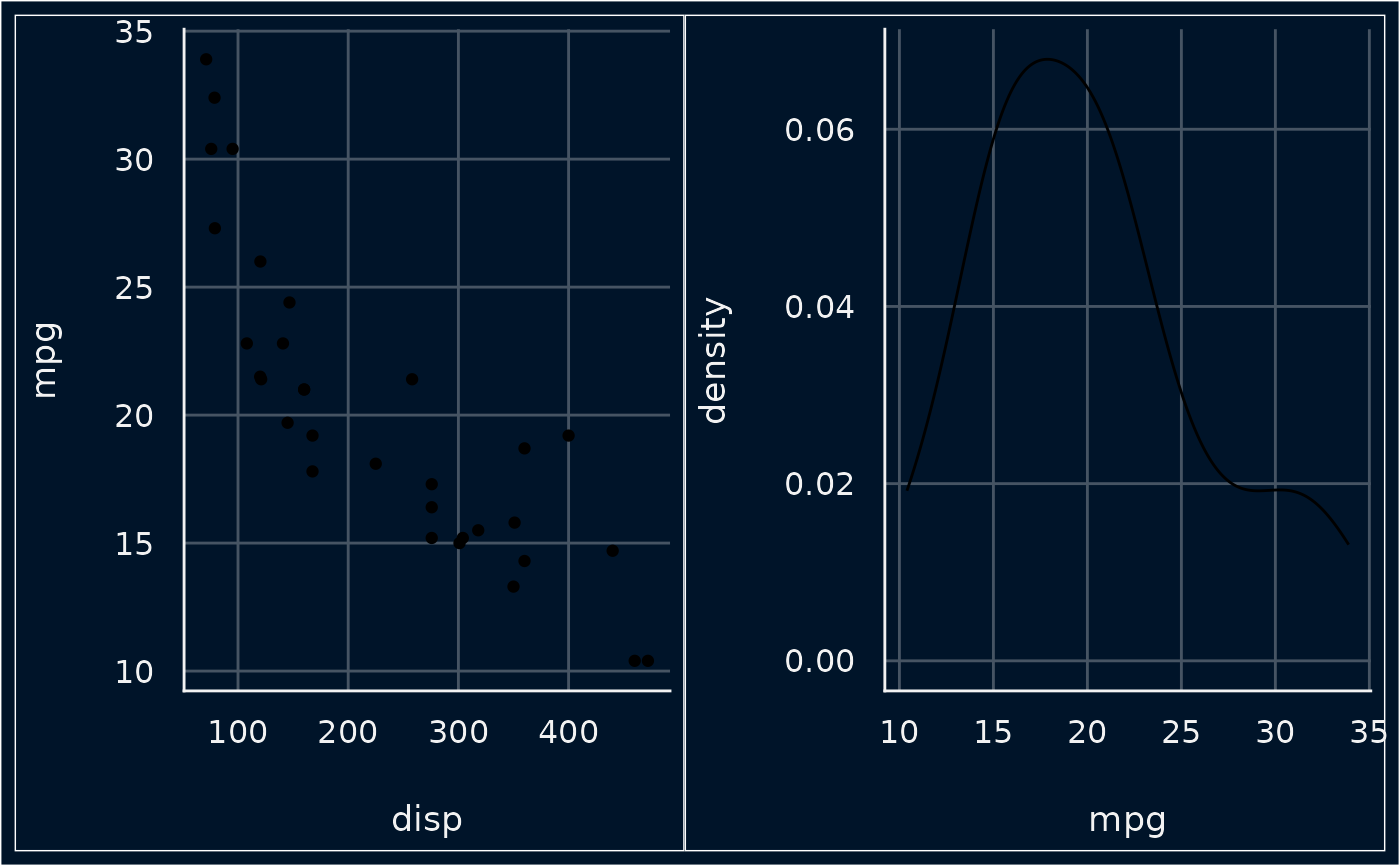
plots(p1, p2)
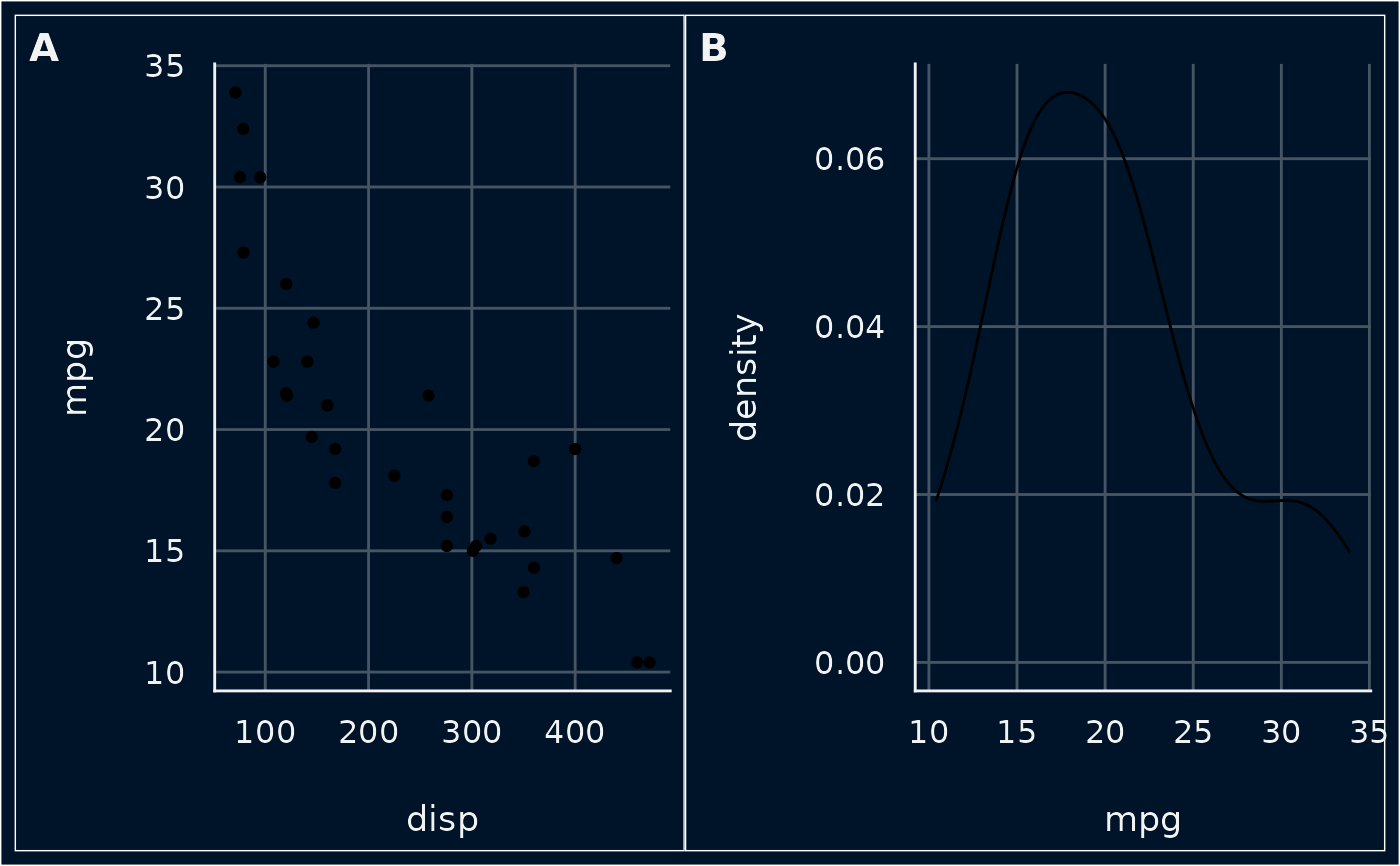
 plots(p1, p2, n_columns = 2, tags = "A")
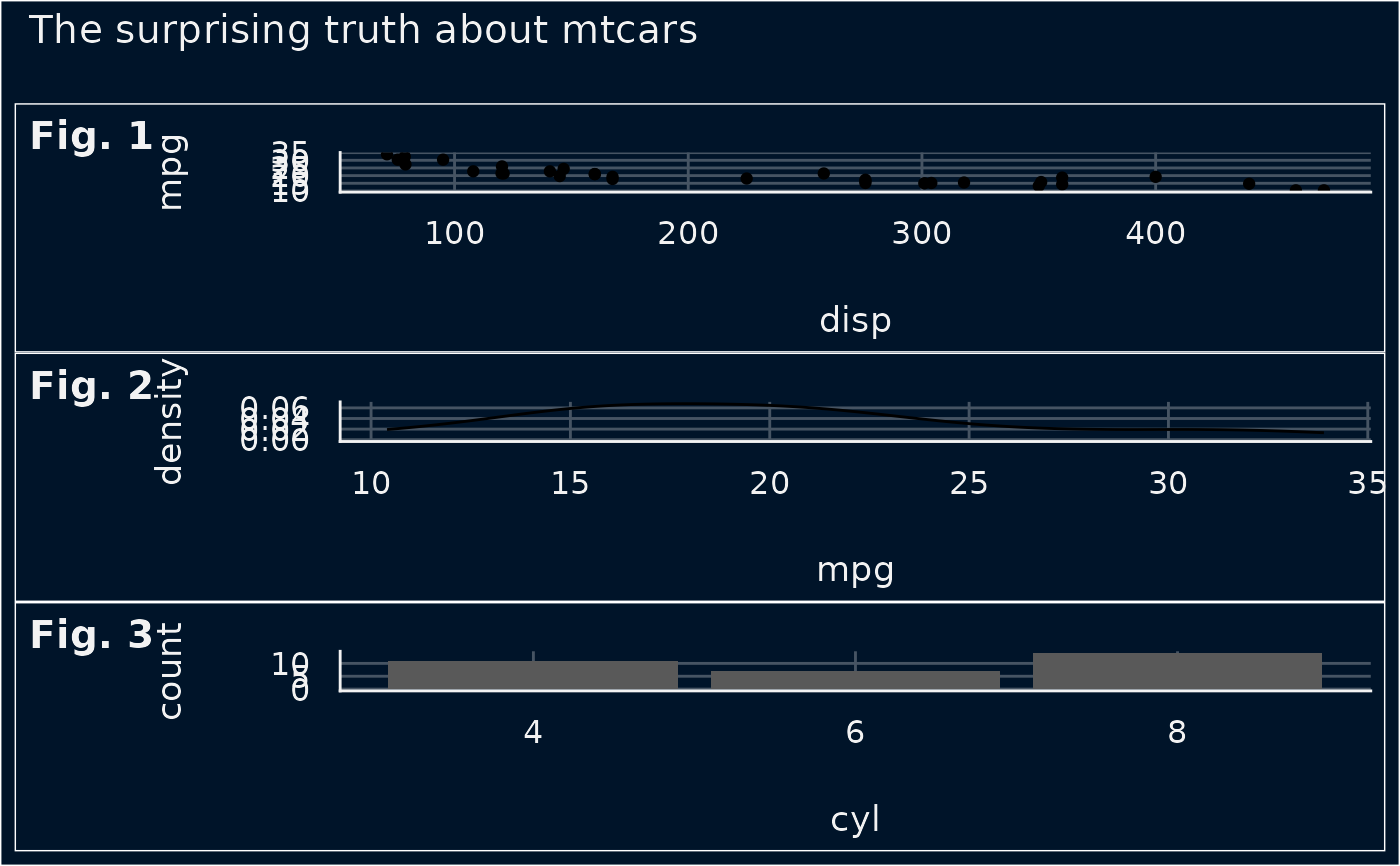
 plots(
p1, p2, p3,
n_columns = 1, tags = c("Fig. 1", "Fig. 2", "Fig. 3"),
title = "The surprising truth about mtcars"
)
plots(
p1, p2, p3,
n_columns = 1, tags = c("Fig. 1", "Fig. 2", "Fig. 3"),
title = "The surprising truth about mtcars"
)