A modern, sleek and elegant theme for ggplot.
theme_modern(
  base_size = 11,
  base_family = "",
  plot.title.size = 1.35 * base_size,
  plot.title.face = "plain",
  plot.title.space = 1.8 * base_size,
  plot.title.position = "plot",
  legend.position = "right",
  axis.title.space = 1.8 * base_size,
  axis.text.space = base_size,
  legend.title.size = 1.2 * base_size,
  legend.text.size = 1.1 * base_size,
  axis.title.size = 1.2 * base_size,
  axis.title.face = "plain",
  axis.text.size = 1.1 * base_size,
  axis.text.angle = NULL,
  tags.size = 1.35 * base_size,
  tags.face = "bold",
  show.ticks = FALSE,
  ...
)
Arguments
- base_size
base font size, given in pts.
- base_family
base font family
- plot.title.size
Title size in pts. Can be "none".
- plot.title.face
Title font face ("plain", "italic", "bold", "bold.italic").
- plot.title.space
Title spacing.
- plot.title.position
Alignment of the plot title/subtitle and caption. The setting for plot.title.position applies to both the title and the subtitle. A value of "panel" (the default) means that titles and/or caption are aligned to the plot panels. A value of "plot" means that titles and/or caption are aligned to the entire plot (minus any space for margins and plot tag).
- legend.position
the default position of legends ("none", "left", "right", "bottom", "top", "inside")
- axis.title.space
Axis title spacing.
- axis.text.space
Axis text spacing, i.e. spacing between axis and the related labels.
- legend.title.size
Legend elements text size in pts.
- legend.text.size
Legend elements text size in pts. Can be "none".
- axis.title.size
Axis title text size in pts.
- axis.title.face
Axis font face ("plain", "italic", "bold", "bold.italic").
- axis.text.size
Axis text size in pts.
- axis.text.angle
Rotate the x axis labels.
Tags text size in pts.
Tags font face ("plain", "italic", "bold", "bold.italic").
- show.ticks
Logical, if
TRUE, adds inner tick marks to the plot and slightly increases the padding between axis and the related labels.- ...
Further arguments passed to
ggplot2::theme().
Note
Base elements like plot borders, titles etc. are scaling with
base_size, i.e. when base_size is increased, all other relevant elements
are increased in proportion to the base size, to ensure proper scaling of
the plot. Set arguments for the related elements explicitly to define custom
sizes.
Examples
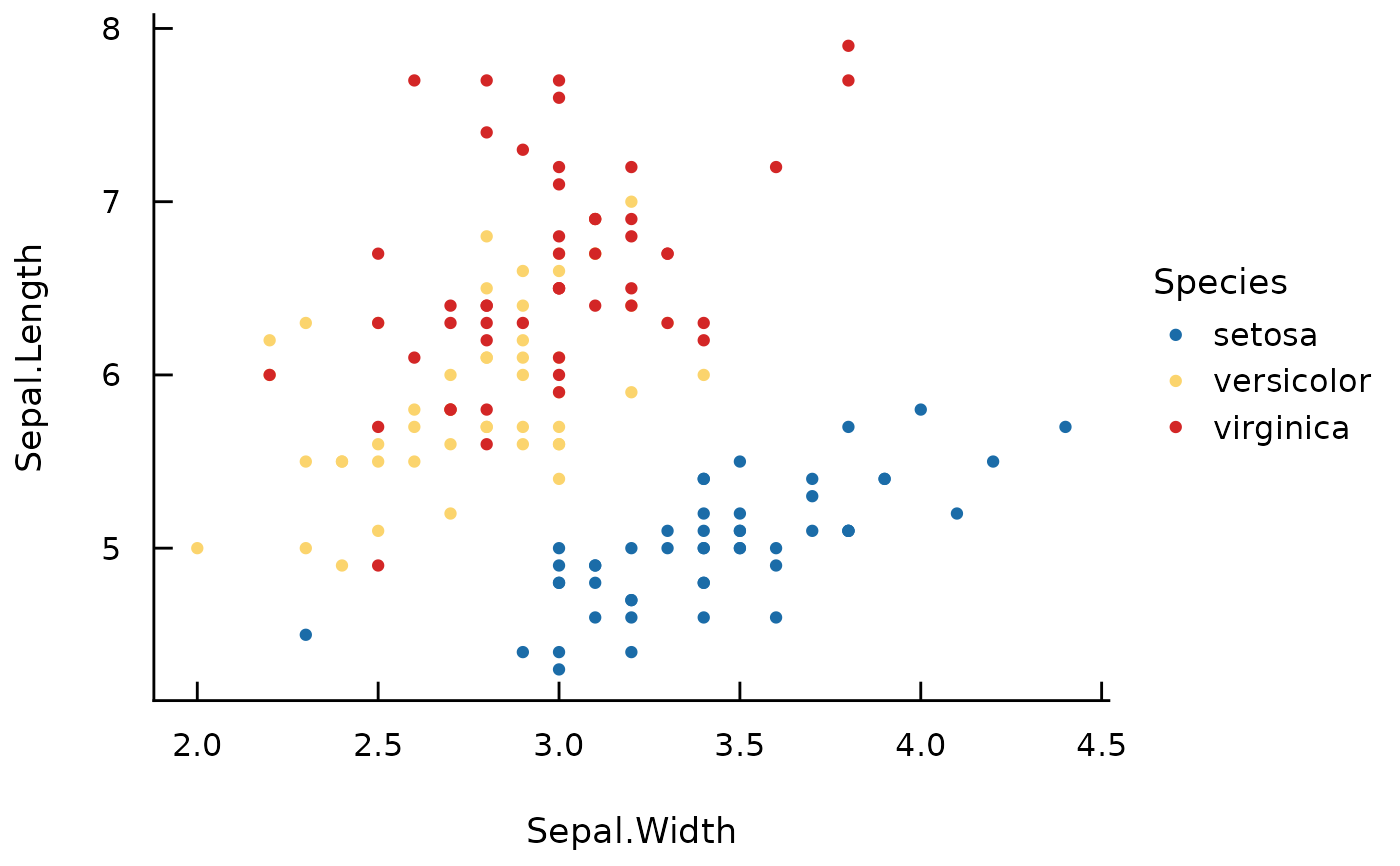
library(ggplot2)
library(see)
ggplot(iris, aes(x = Sepal.Width, y = Sepal.Length, color = Species)) +
geom_point() +
scale_color_see() +
theme_modern()
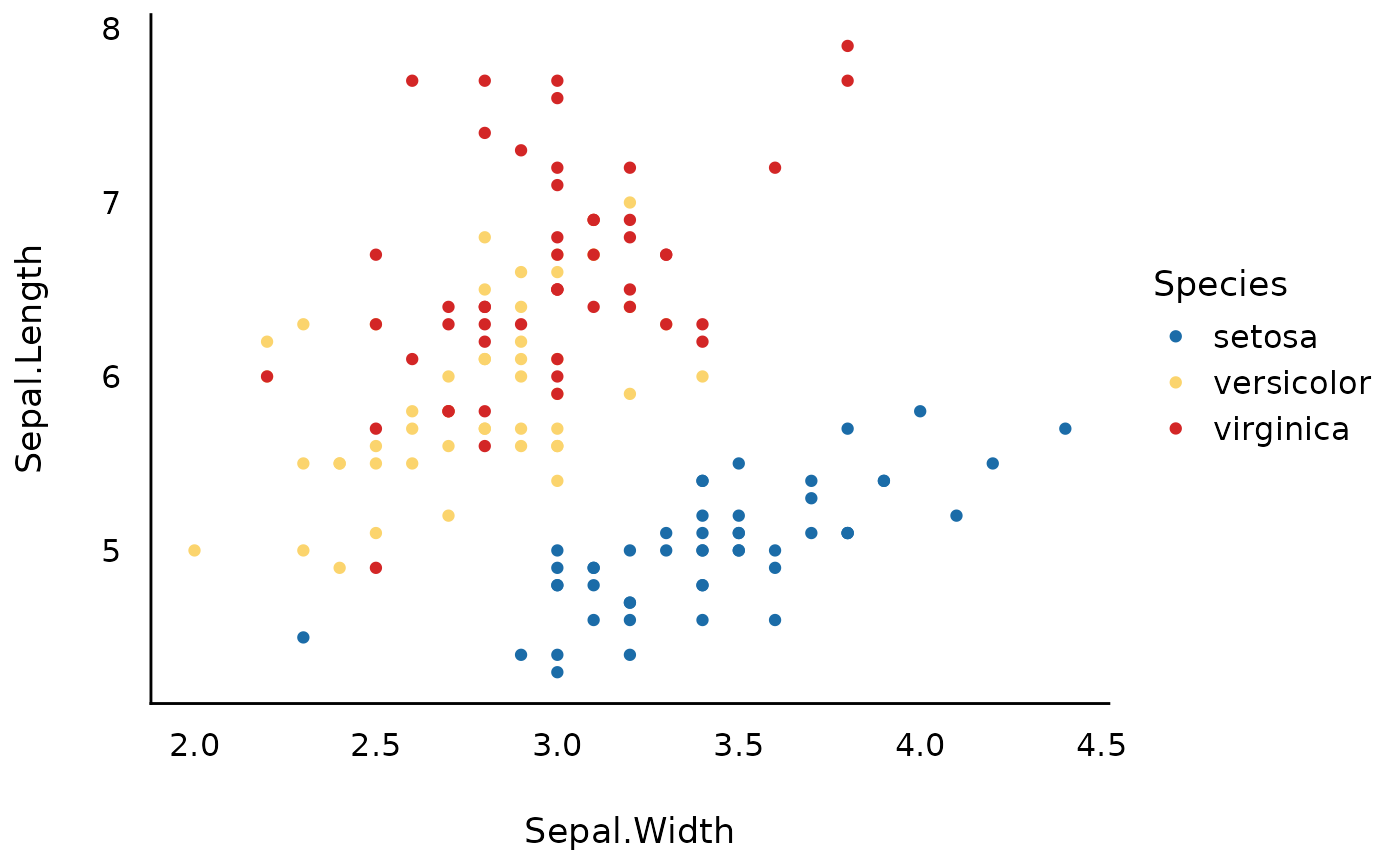 # for a slightly better orientation, tick marks can be added
ggplot(iris, aes(x = Sepal.Width, y = Sepal.Length, color = Species)) +
geom_point() +
scale_color_see() +
theme_modern(show.ticks = TRUE)
# for a slightly better orientation, tick marks can be added
ggplot(iris, aes(x = Sepal.Width, y = Sepal.Length, color = Species)) +
geom_point() +
scale_color_see() +
theme_modern(show.ticks = TRUE)