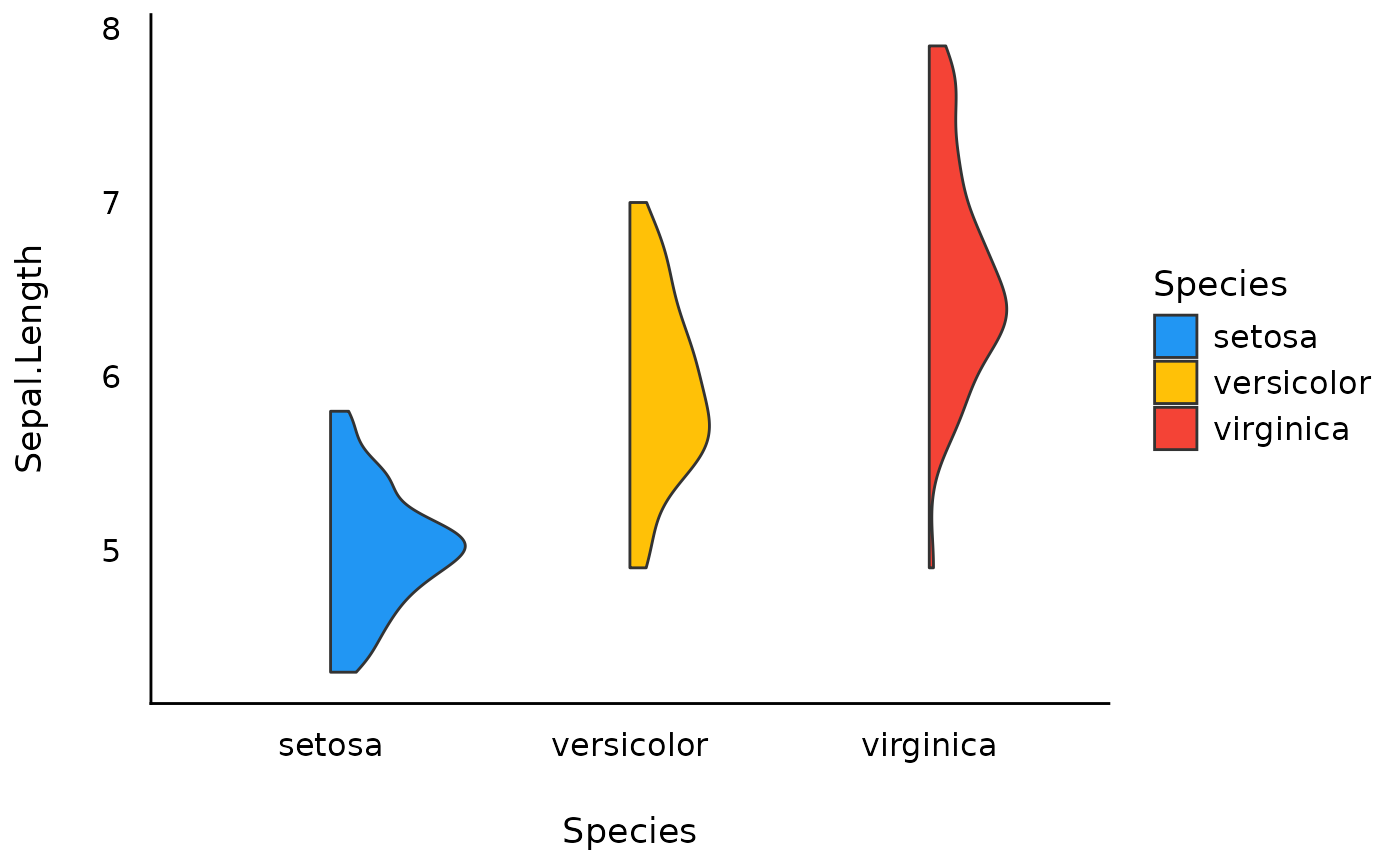
Create a half-violin plot. The half violins are drawn with
ggdist::stat_slab(), so this function needs the ggdist package
(version 3.3.3 or later). By default, each half violin is at most 0.45
times the spacing of the categorical axis wide (0.45 units on a discrete
axis), as before. When groups are dodged, as with fill mapped to a second
variable, each group takes half of its dodge cell, from the cell's centre
toward its side, as in see 0.14.
Usage
geom_violinhalf(
  mapping = NULL,
  data = NULL,
  stat = "ydensity",
  position = "dodge",
  trim = TRUE,
  flip = FALSE,
  scale = c("area", "count", "width"),
  show.legend = NA,
  inherit.aes = TRUE,
  interval = FALSE,
  ...
)
Arguments
- mapping
Set of aesthetic mappings created by
aes(). If specified andinherit.aes = TRUE(the default), it is combined with the default mapping at the top level of the plot. You must supplymappingif there is no plot mapping.- data
The data to be displayed in this layer. There are three options:
If
NULL, the default, the data is inherited from the plot data as specified in the call toggplot().A
data.frame, or other object, will override the plot data. All objects will be fortified to produce a data frame. Seefortify()for which variables will be created.A
functionwill be called with a single argument, the plot data. The return value must be adata.frame, and will be used as the layer data. Afunctioncan be created from aformula(e.g.~ head(.x, 10)).- stat
Kept for backward compatibility. The density is always computed by
ggdist::stat_slab(), and any value other than"ydensity"or ggplot2::StatYdensity is ignored with a warning.- position
A position adjustment to use on the data for this layer. This can be used in various ways, including to prevent overplotting and improving the display. The
positionargument accepts the following:The result of calling a position function, such as
position_jitter(). This method allows for passing extra arguments to the position.A string naming the position adjustment. To give the position as a string, strip the function name of the
position_prefix. For example, to useposition_jitter(), give the position as"jitter".For more information and other ways to specify the position, see the layer position documentation.
- trim
If
TRUE(default), trim the tails of the half violins to the range of the data. IfFALSE, extend the tails asggplot2::geom_violin()does.- flip
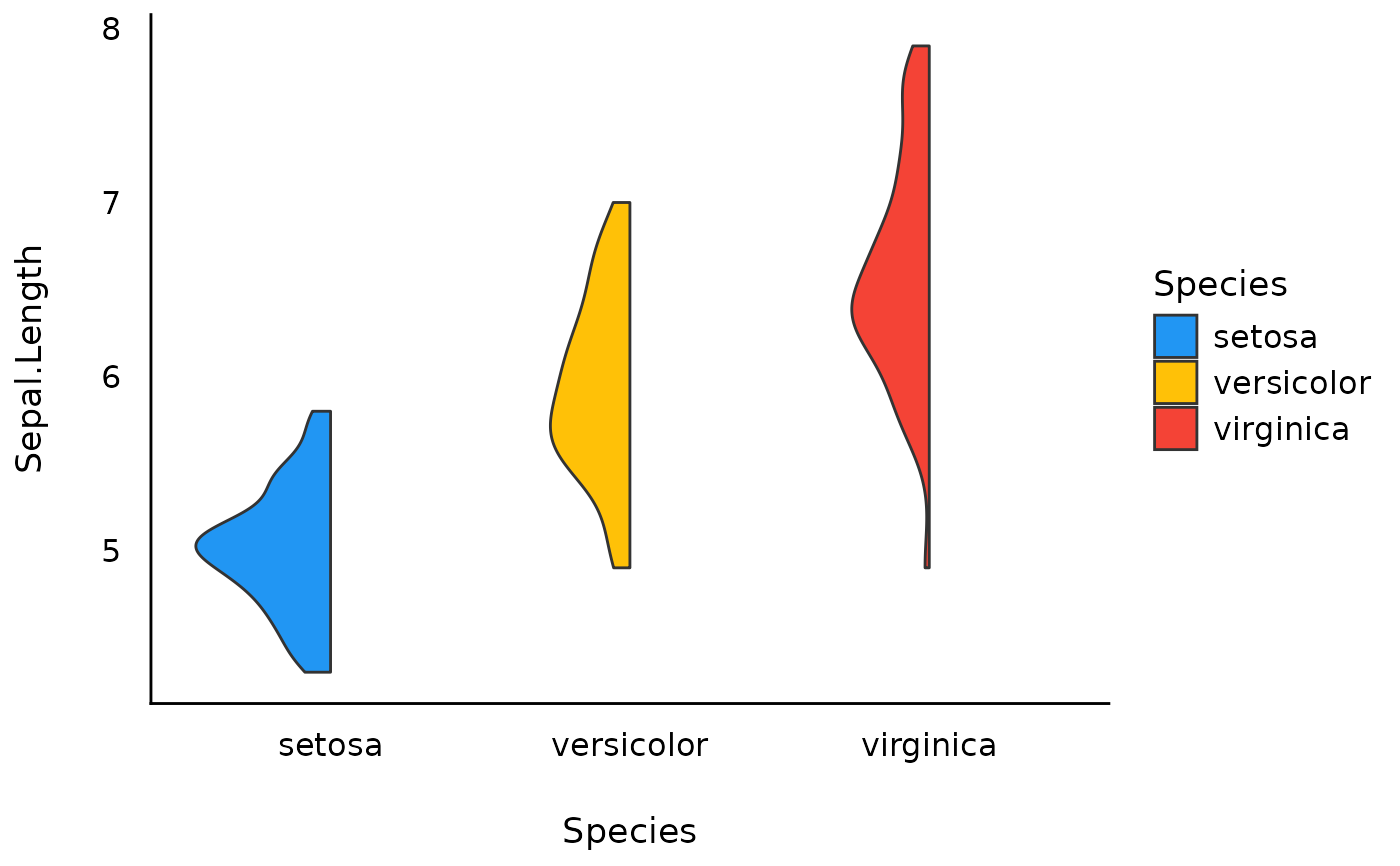
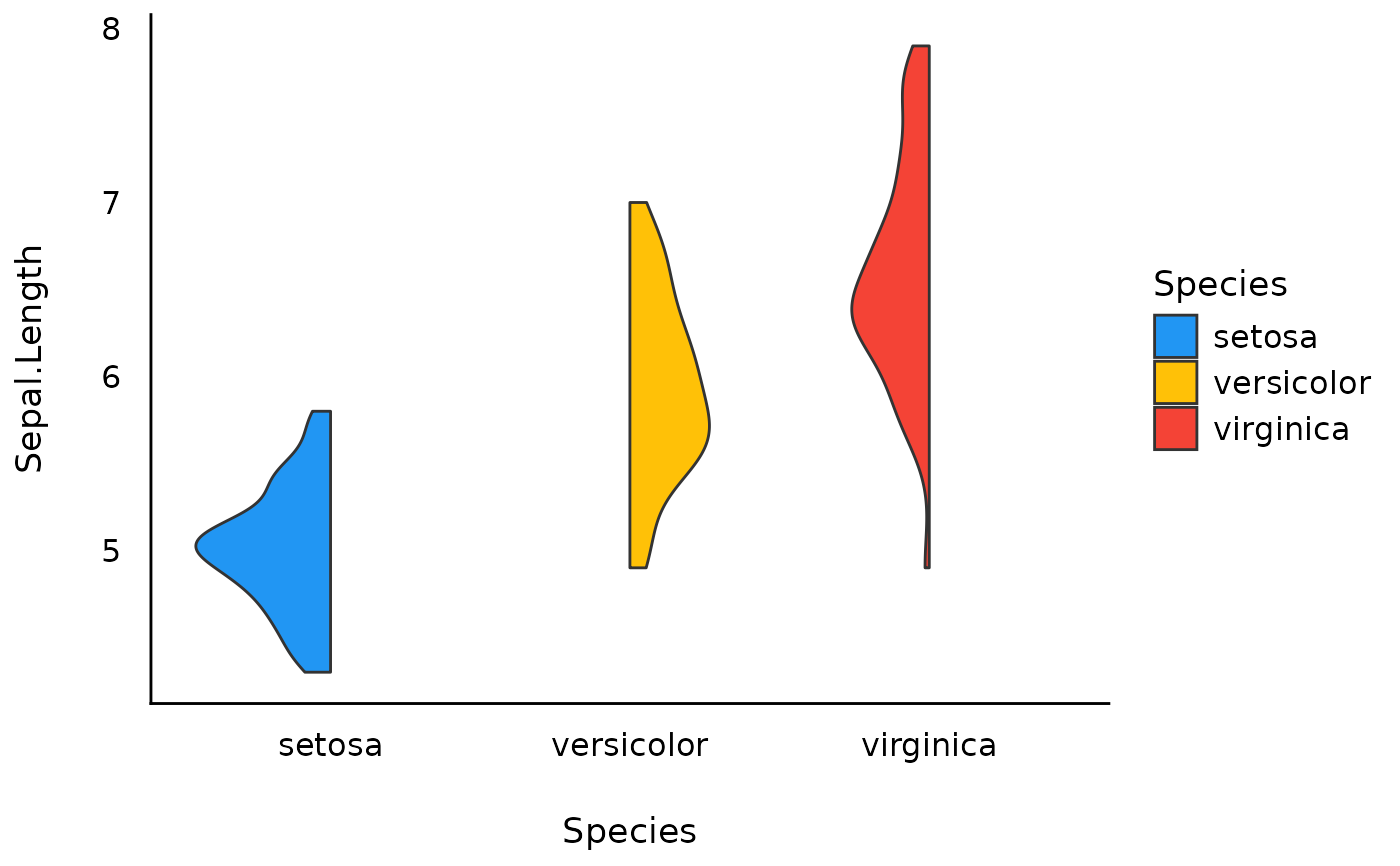
Should the half-violin plot switch directions? By default, this is
FALSEand each half violin extends to the right of its position (up, in a horizontal plot), with its flat side on the left. Ifflip = TRUE, all half violins extend to the left (down). Optionally, a numeric vector can be supplied indicating which specific geoms should be flipped. See examples for more details.- scale
If
"area"(default), all half violins have the same area (before trimming the tails). If"count", areas are scaled proportionally to the number of observations. If"width", all half violins have the same maximum width.- show.legend
logical. Should this layer be included in the legends?
NA, the default, includes if any aesthetics are mapped.FALSEnever includes, andTRUEalways includes. It can also be a named logical vector to finely select the aesthetics to display. To include legend keys for all levels, even when no data exists, useTRUE. IfNA, all levels are shown in legend, but unobserved levels are omitted.- inherit.aes
If
FALSE, overrides the default aesthetics, rather than combining with them. This is most useful for helper functions that define both data and aesthetics and shouldn't inherit behaviour from the default plot specification, e.g.annotation_borders().- interval
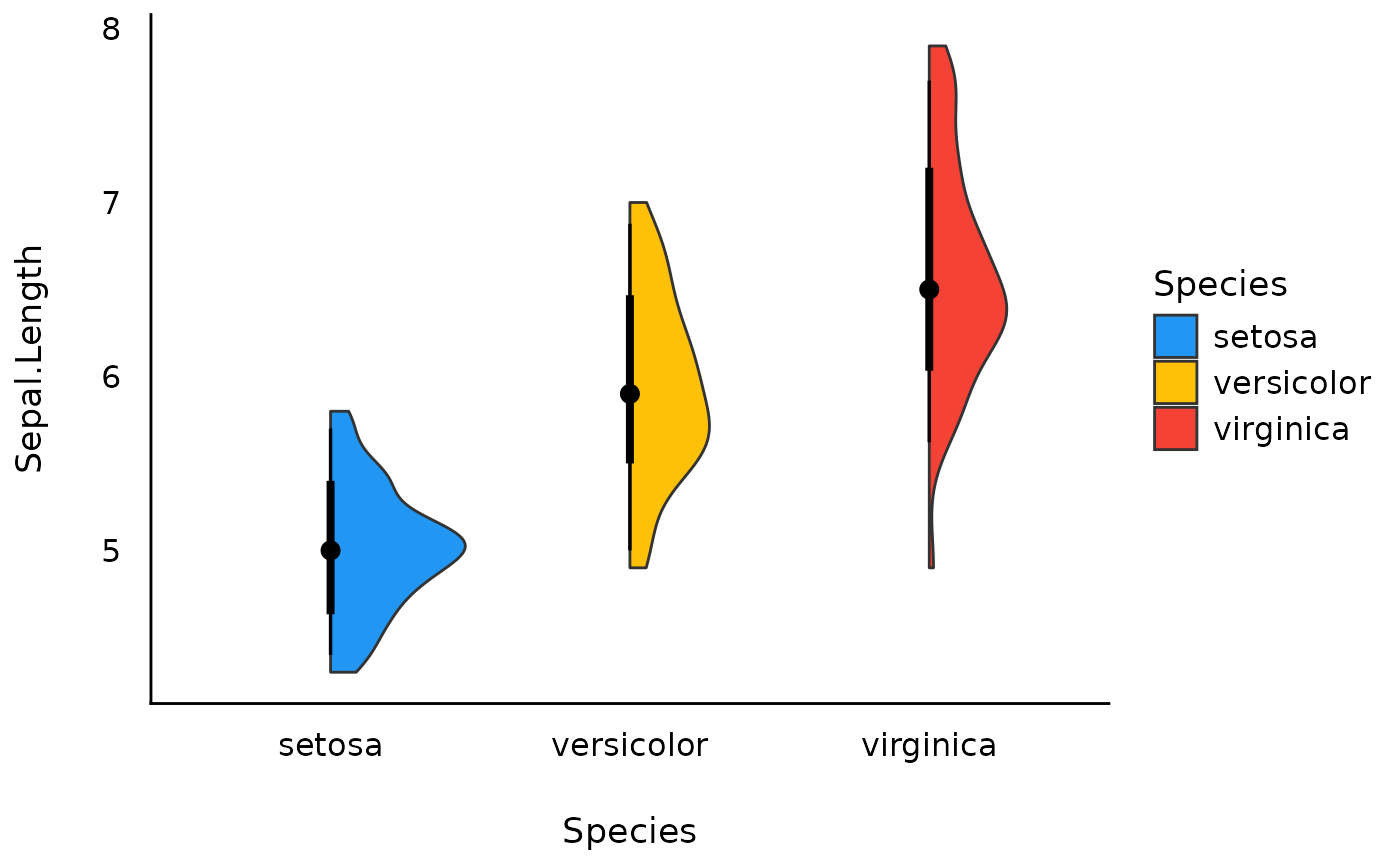
Logical. If
TRUE, add the median and the 66% and 95% quantile intervals of each group, drawn withggdist::stat_slabinterval()without the slab, as inggdist::stat_pointinterval(). Default isFALSE.- ...
Other arguments passed to
ggdist::stat_slab(), such ascolour,fill,alpha, oradjust. As inggplot2::geom_violin():bwsets the bandwidth of the density (default"nrd0"): a number, or one of"nrd0","nrd","ucv","bcv","SJ", or"dpi".kernelsets the kernel (default"gaussian").boundssets known bounds of the data, which must contain all values.width(orheight, in a horizontal plot) is the width of a whole violin, so each half violin is half as wide.
drophas no effect. The half violins of groups with fewer than two observations, or with all values equal, are not drawn, with a warning, but they keep their space when dodged, and their intervals are drawn..width,point_interval,show_point,show_interval,fatten_point,arrow, and thepoint_andinterval_aesthetics, such aspoint_size, go to the interval.
Examples
library(ggplot2)
library(see)
ggplot(iris, aes(x = Species, y = Sepal.Length, fill = Species)) +
geom_violinhalf() +
theme_modern() +
scale_fill_material_d()
 # To flip all half-violin geoms, use `flip = TRUE`:
ggplot(iris, aes(x = Species, y = Sepal.Length, fill = Species)) +
geom_violinhalf(flip = TRUE) +
theme_modern() +
scale_fill_material_d()
 # To flip the half-violin geoms for the first and third groups only
# by passing a numeric vector
ggplot(iris, aes(x = Species, y = Sepal.Length, fill = Species)) +
geom_violinhalf(flip = c(1, 3)) +
theme_modern() +
scale_fill_material_d()
 # To add the median and quantile intervals
ggplot(iris, aes(x = Species, y = Sepal.Length, fill = Species)) +
geom_violinhalf(interval = TRUE) +
theme_modern() +
scale_fill_material_d()