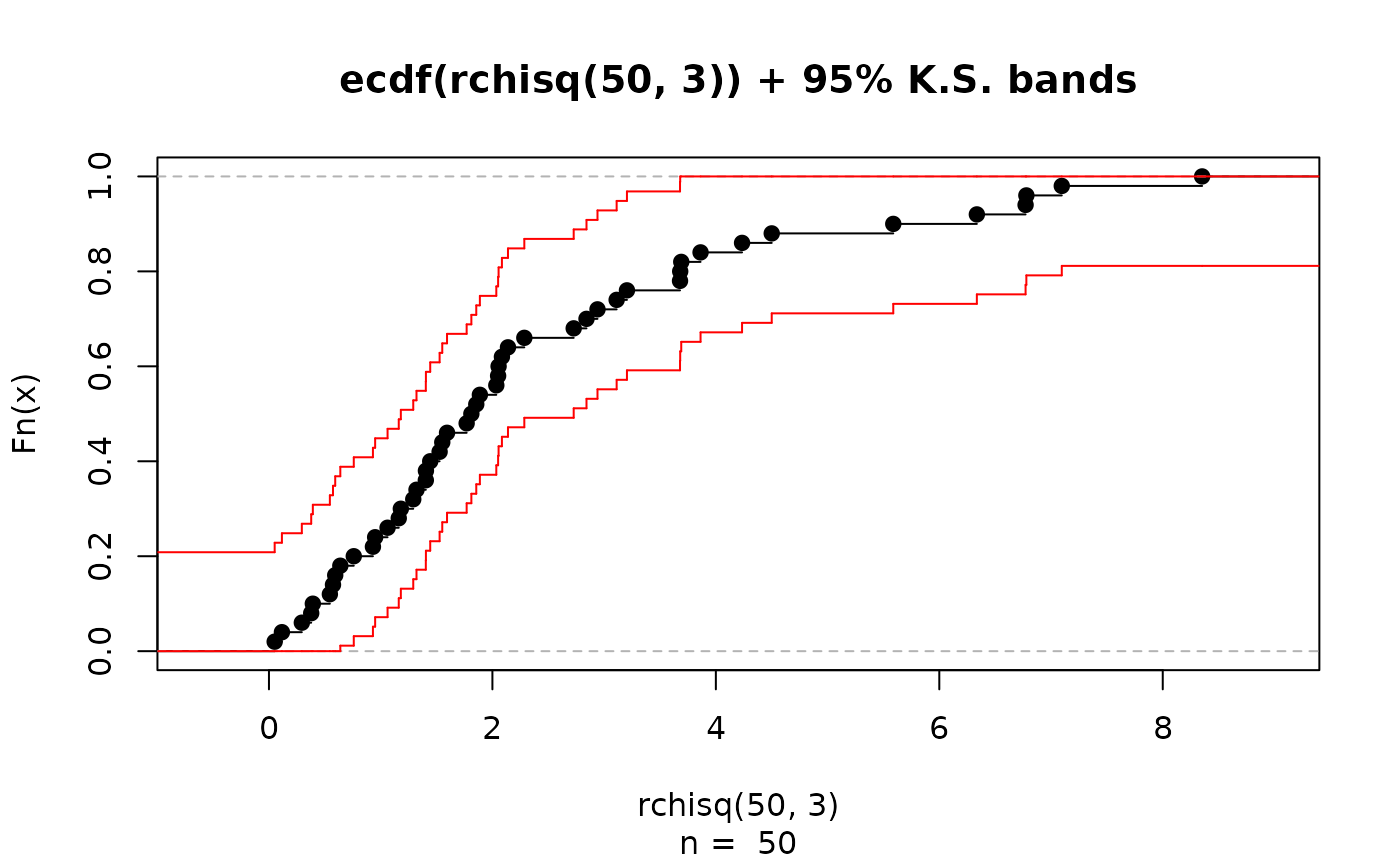
Plot Empirical Distribution Function With 95% Confidence Curves
ecdf.ksCI.RdPlots the empirical (cumulative) distribution function (ECDF) for
univariate data, together with upper and lower simultaneous 95% confidence curves,
computed via Kolmogorov-Smirnov' \(D\), see KSd.
ecdf.ksCI(x, main = NULL, sub = NULL, xlab = deparse(substitute(x)),
          ci.col = "red", ...)
Arguments
- x
xnumerical vector of observations.- main,sub,xlab
arguments passed to
title.- ci.col
color for confidence interval lines.
- ...
optional arguments passed to
plot.stepfun.
Value
Nothing. Used for its side effect, to produce a plot.
References
Bickel and Doksum, see KSd.
Note
Presently, will only work if length(x) > 9.
See also
ecdf and plot.stepfun in standard
R.
Examples
ecdf.ksCI( rchisq(50,3) )