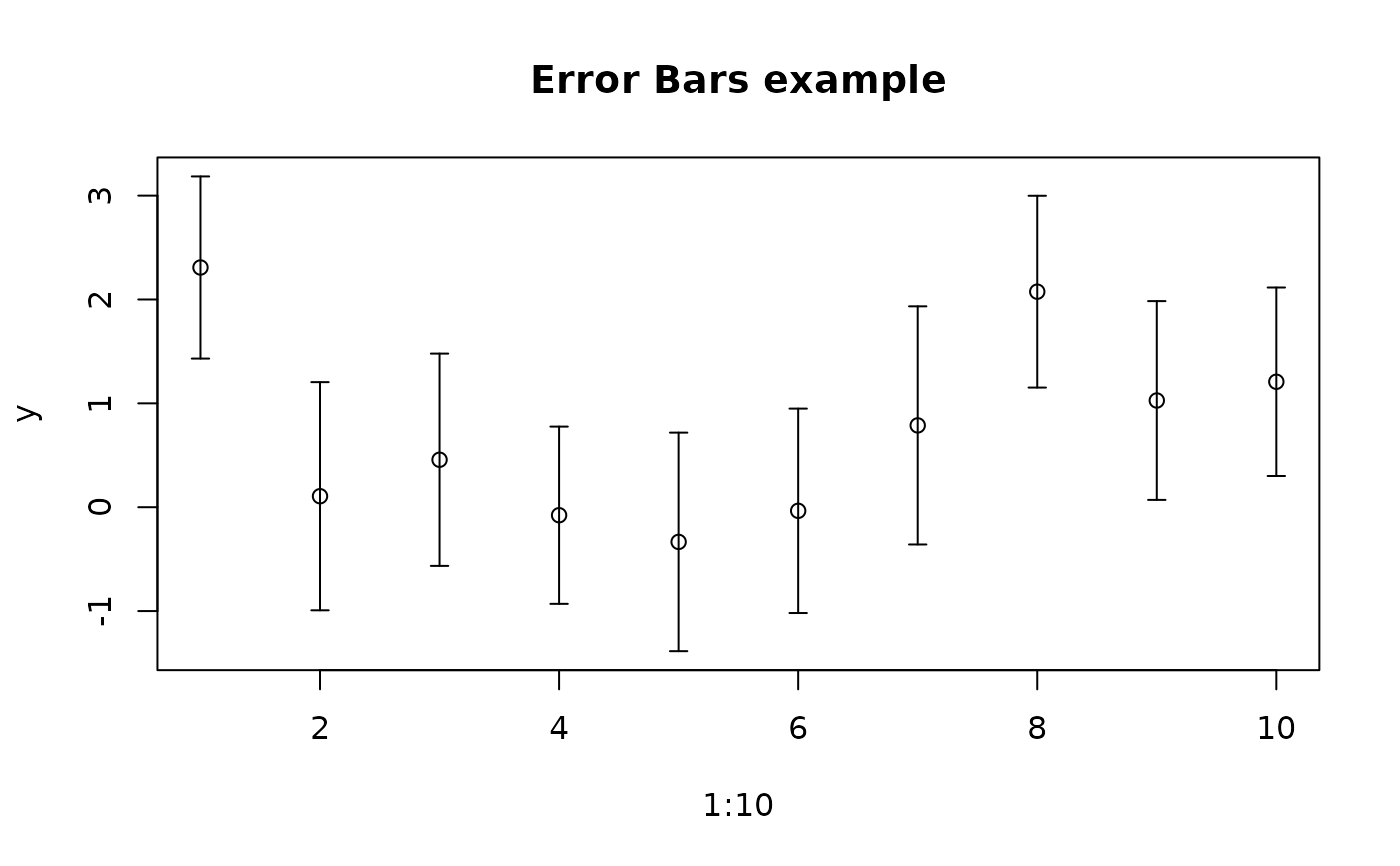
Scatter Plot with Error Bars
errbar.RdDraws a scatter plot, adding vertical “error bars” to all the points.
errbar(x, y, yplus, yminus, cap = 0.015,
       ylim = range(y,yplus,yminus),
       xlab= deparse(substitute(x)),
       ylab= deparse(substitute(y)), ...)
Arguments
- x
vector of x values.
- y
vector of y values.
- yplus
vector of y values: the tops of the error bars.
- yminus
vector of y values: the bottoms of the error bars.
- cap
the width of the little lines at the tops and bottoms of the error bars in units of the width of the plot. Default is 0.015.
- ylim
(numeric of length 2): the y-axis extents with a sensible default.
- xlab, ylab
axis labels for the plot, as in
plot.default.- ...
Graphical parameters (see
par) may also be supplied as arguments to this function.
See also
errbar in package Hmisc is similar.