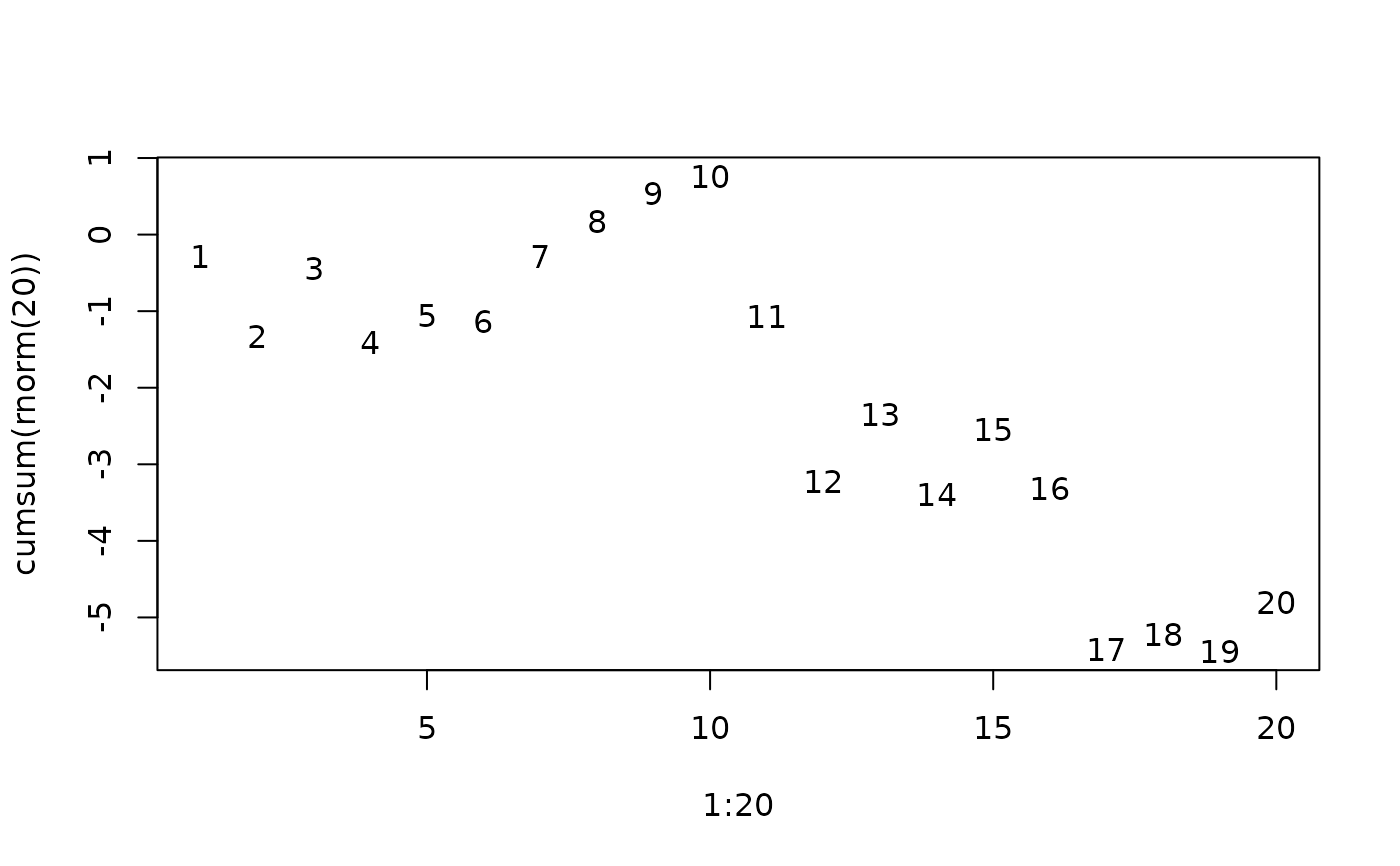
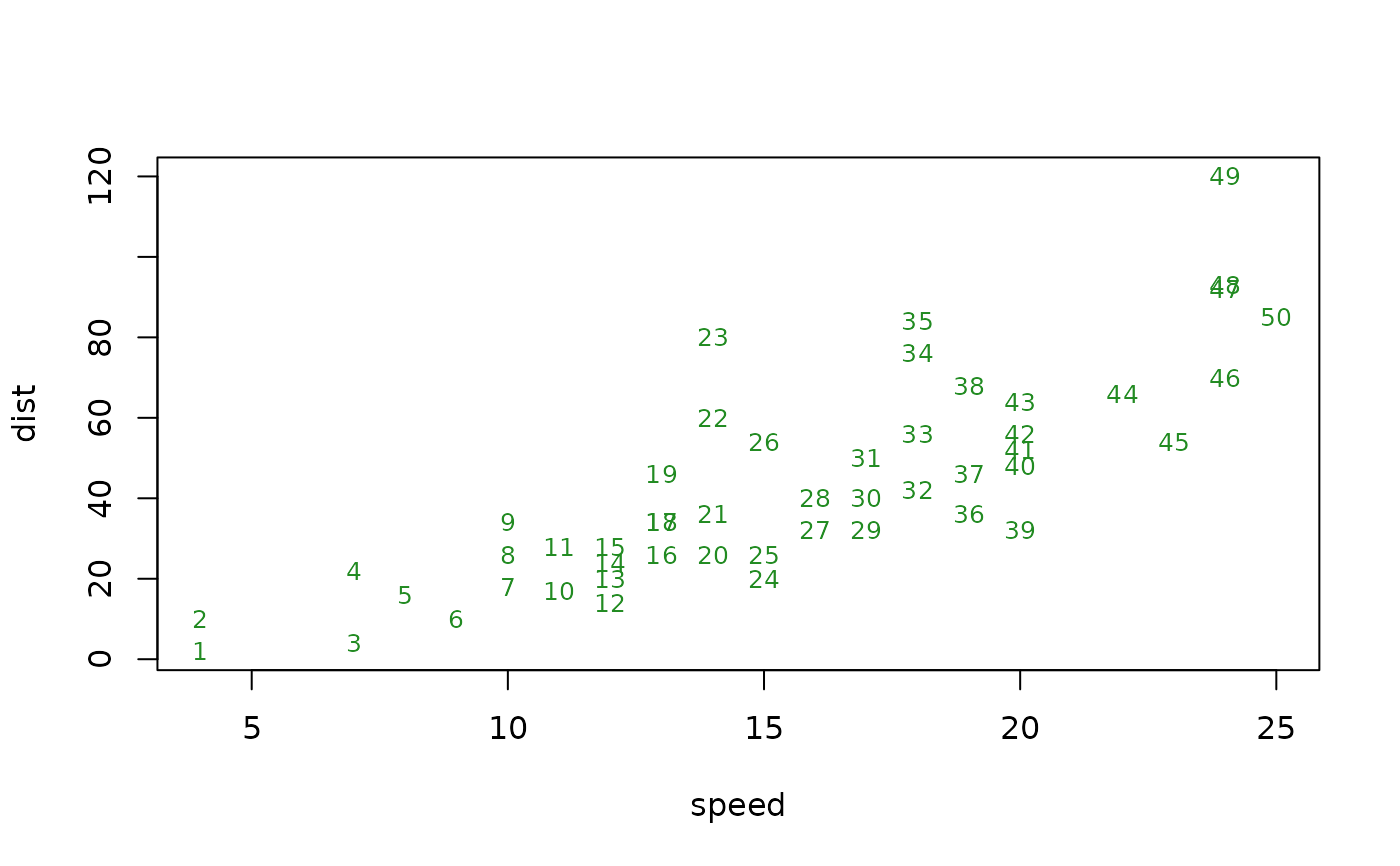
Name Plot: Names or Numbers instead of Points in Plot
n.plot.RdA utility function which basically calls plot(*, type="n")
and text. To have names or numbers instead of points
in a plot is useful for identifaction, e.g., in a residual plot, see
also TA.plot.
Arguments
- x,y
coordinates at which to plot. If
yis missing,xis used for both, if it's adata.frame, list, 2-column matrix etc – viaxy.coords; formula do not work.- nam
the labels to plot at each (x,y). Per default, these taken from the data
xandy; case numbers1:nare taken if no names are available.- abbr
logical indicating if the
namlabels should be abbreviated – with a sensible default.- xlab,ylab
labels for the x- and y- axis, the latter being empty by default.
- log
character specifying if log scaled axes should be used, see
plot.default.- cex
plotting character expansion, see
par.- col
color to use for
text().- ...
further arguments to be passed to the
plotcall.
Value
invisibly, a character vector with the labels used.