Extended / Engineering Axis for Graphics
eaxis.Rd
An extended axis() function which labels more
prettily, in particular for log-scale axes.
It makes use of plotmath or (LaTeX) expressions of
the form \(k \times 10^k\) for labeling a
log-scaled axis and when otherwise exponential formatting would be
used (see pretty10exp).
Usage
eaxis(side, at = if(log) axTicks(side, axp=axp, log=log, nintLog=nintLog)
                 else    axTicks(side, axp=axp, log=log),
      labels = NULL, log = NULL,
      use.expr = log || format.info(as.numeric(at), digits=7)[3] > 0,
      f.smalltcl = 3/5, at.small = NULL, small.mult = NULL, equidist.at.tol = 0.002,
      small.args = list(),
      draw.between.ticks = TRUE, between.max = 4,
      outer.at = TRUE, drop.1 = TRUE, sub10 = FALSE, las = 1,
      nintLog = max(12, par("lab")[2 - is.x]),
      axp = NULL, n.axp = NULL, max.at = Inf,
      lab.type = "plotmath", lab.sep = "cdot",
      ...)
Arguments
- side
integer in 1:4, specifying side of
axis.- at
numeric vector of (“normalsized”) tick locations; by default
axTicks(side, ..), i.e., the same asaxis()would use.- labels
NULL(default),logical,characterorexpression, as inaxis(); in addition, ifNA,labels = TRUEis passed toaxis(), i.e.pretty10expis not used. UseFALSEto suppress any labeling.- log
logical or
NULLspecifying if log-scale should be used; the default depends on the current plot's axis.- use.expr
logical specifying if
pretty10exp(.)should be used for constructinglabelswhen they areNULL. The default is typically good enough, but you may occasionally forceuse.expr = TRUE.- f.smalltcl
factor specifying the lengths of the small ticks in proportion to the normalsized, labeled ticks.
- at.small
locations of small ticks; the default,
NULL, usessmall.multand constructs “smart” locations.- small.mult
positive integer (or
NULL), used whenat.smallis NULL to indicate which multiples ofat(typicallyaxTicks()) should be used as “small ticks”. The defaultNULLwill use9in the log case and a number in 2:5 otherwise.
- equidist.at.tol
a small positive number, a tolerance to be used for checking equidistant
atvalues. Used to be hardwired at.001which was seen to be too small; increase it when necessary.- small.args
optional
listof further arguments to the (second)axis()call which draws the small ticks.- draw.between.ticks
(only if
logis true): logical indicating that possible (non-small) ticks between the labeled (viaat) ones should be drawn as well (and possibly also used forat.smallconstruction), see alsobetween.max.- between.max
(only if
loganddraw.between.ticksare true): integer indicating ticks should be drawn (approximately) between the labeled ones.- outer.at
logical specifying that
at.smallshould also be constructed outside theatrange, but still inside the correspondingpar("usr").- drop.1
logical specifying if \(1 \times\) should be dropped from labels, passed to
pretty10exp().- sub10
logical, integer (of length 1 or 2),
"10"or"100", indicating if some \(10^k\) should be simplified to “traditional” formats, seepretty10exp.- nintLog
only used in R > 2.13.x, when
logis true: approximate (lower bound on) number of intervals for log scaling.- axp
to be passed to
axTicks()ifatis not specified.- n.axp
to be set to
axp[3]whenaxpandatare not specified, in order to tweak the number of (non-small) tick marks produced fromaxTicks(..), notably whenlogis true, setn.axpto 1, 2, or 3:- 1:
will produce tick marks at \(10^j\) for integer \(j\),
- 2:
gives marks \(k 10^j\) with \(k \in \{1, 5\}\),
- 3:
gives marks \(k 10^j\) with \(k \in \{1, 2, 5\}\)
see
'xaxp'on theparhelp page.- max.at
maximal number of
atvalues to be used effectively. If you don't specifyatyourself carefully, it is recommended to set this to something like25, but this is not the default, for back compatibility reasons.- las, ...
arguments passed to (the first)
axiscall. Note that the defaultlas = 1differs fromaxis's defaultlas = 0.- lab.type
string, passed to
pretty10expto choose between defaultplotmathor LaTeX label format.- lab.sep
separator between mantissa and exponent for LaTeX labels, see
pretty10exp.
Examples
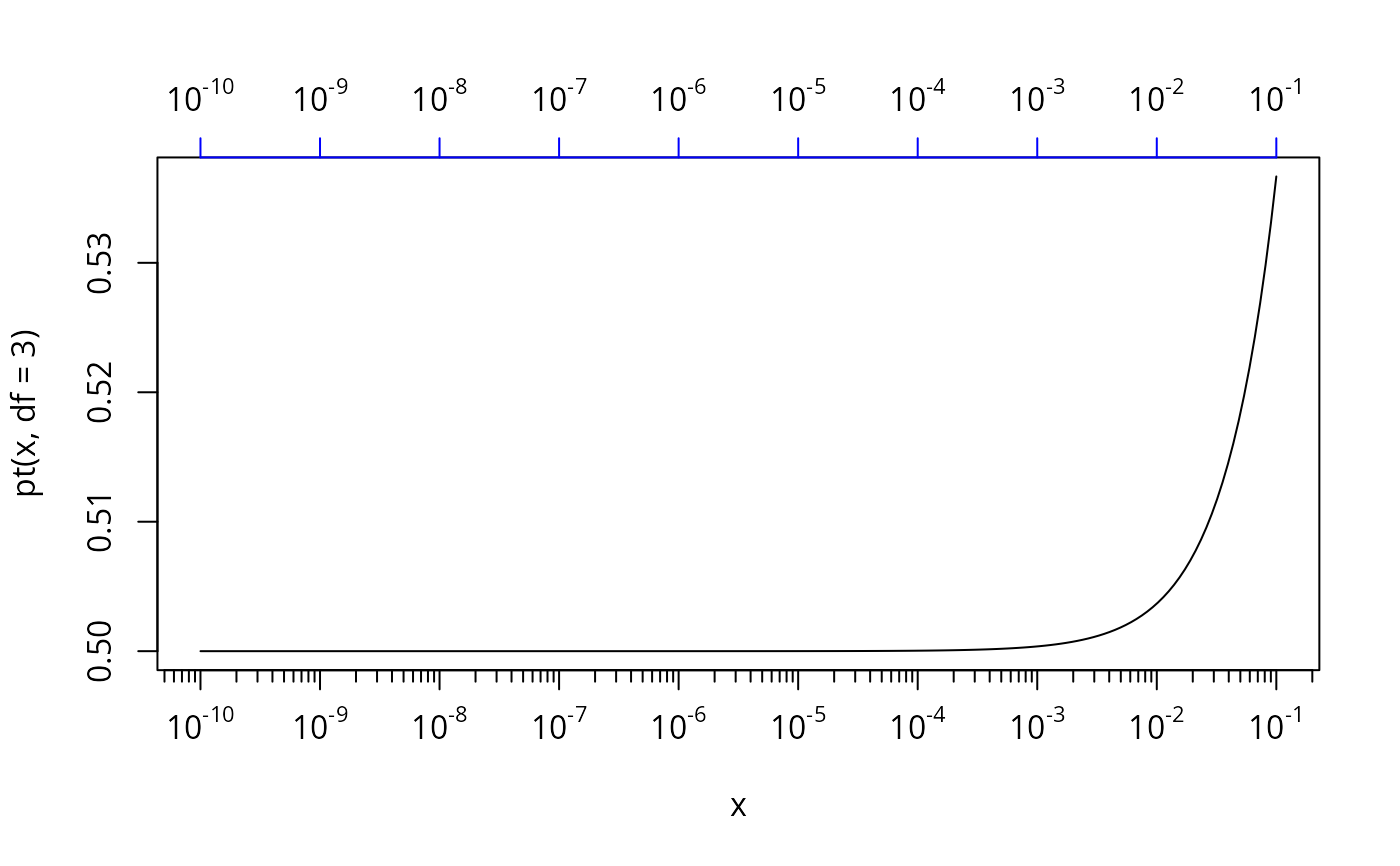
x <- lseq(1e-10, 0.1, length = 201)
plot(x, pt(x, df=3), type = "l", xaxt = "n", log = "x")
eaxis(1)
## without small ticks:
eaxis(3, at.small=FALSE, col="blue")
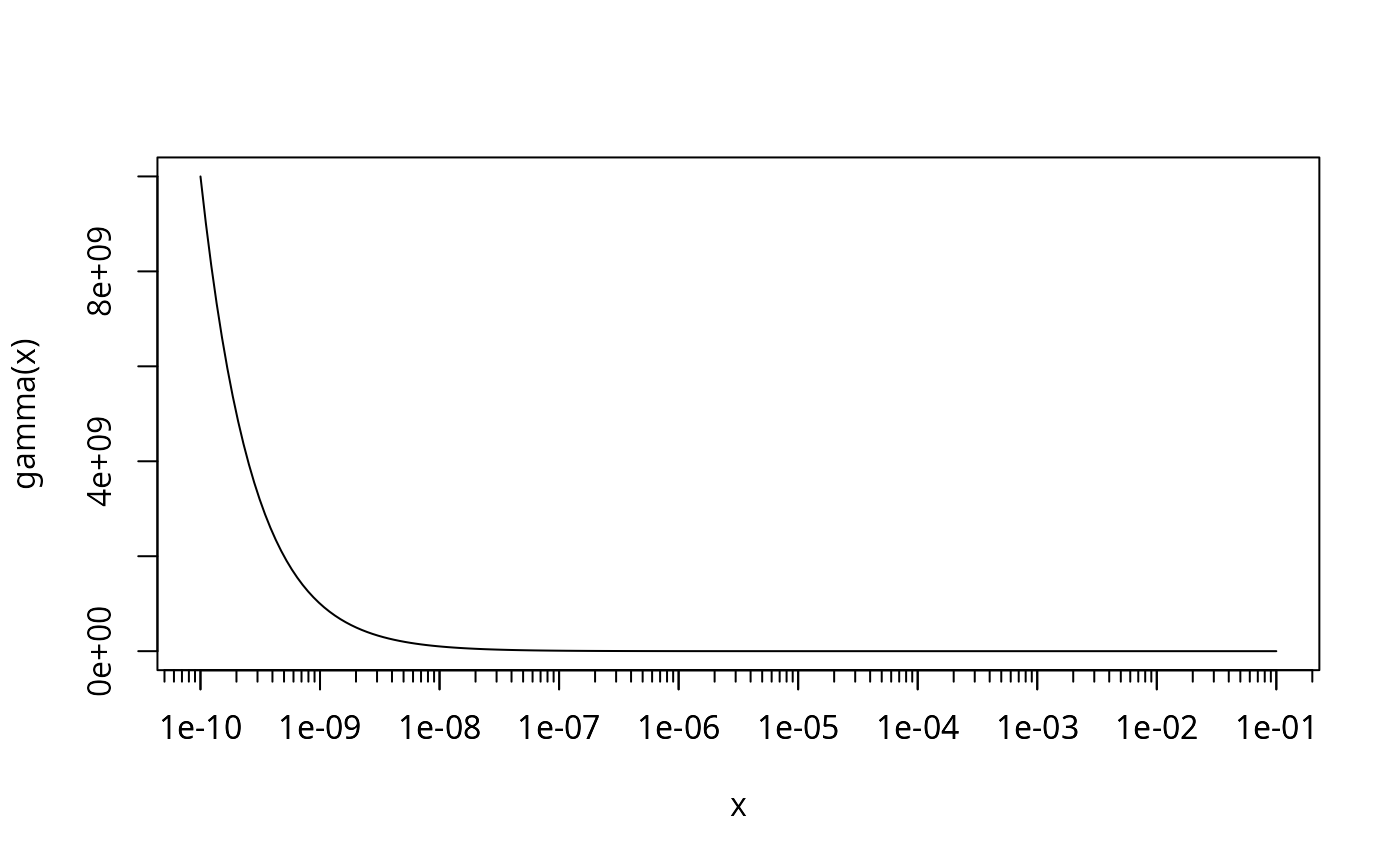
 ## If you like the ticks, but prefer traditional (non-"plotmath") labels:
plot(x, gamma(x), type = "l", log = "x")
eaxis(1, labels=NA)
## If you like the ticks, but prefer traditional (non-"plotmath") labels:
plot(x, gamma(x), type = "l", log = "x")
eaxis(1, labels=NA)
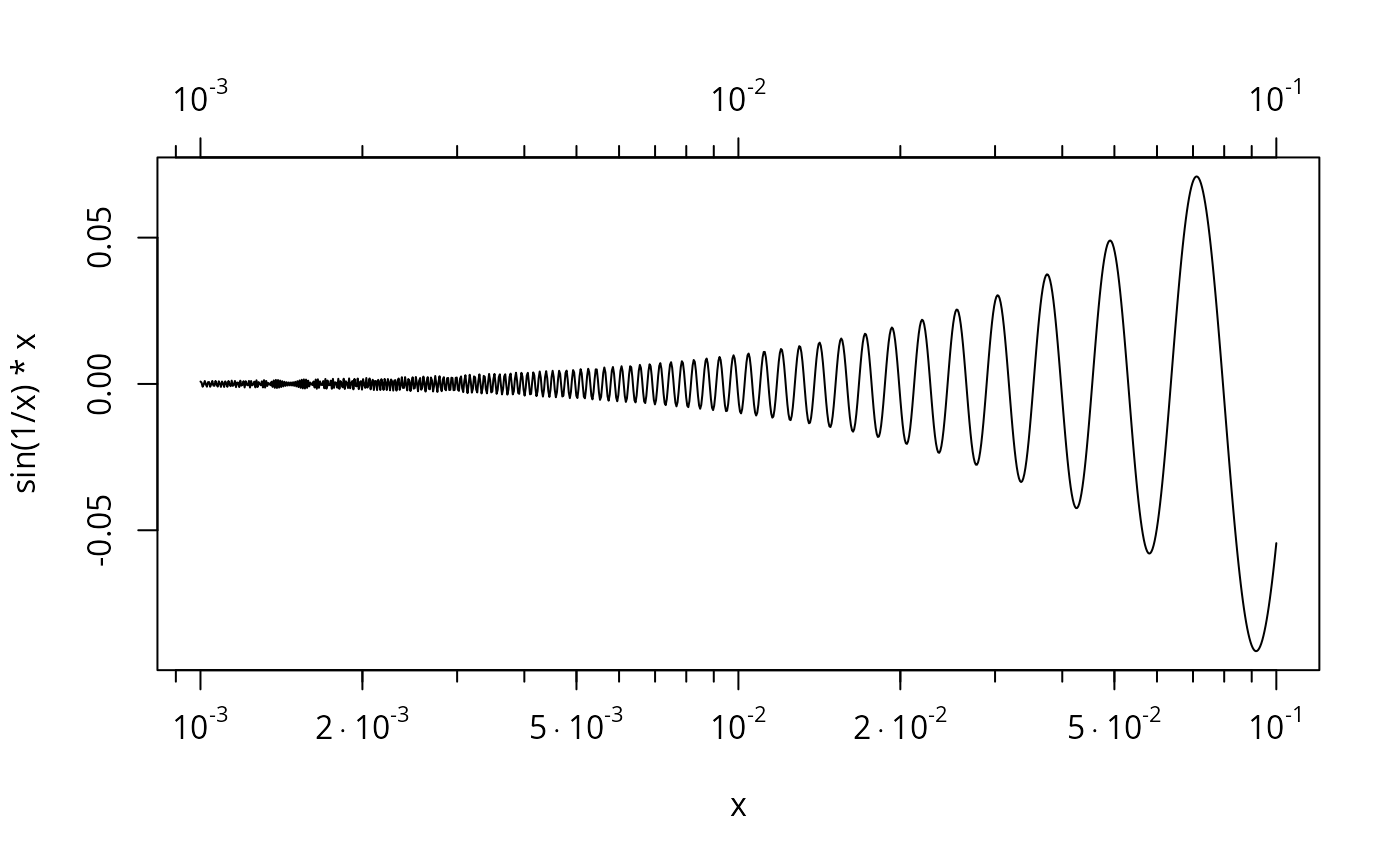
 x <- lseq(.001, 0.1, length = 1000)
plot(x, sin(1/x)*x, type = "l", xaxt = "n", log = "x")
eaxis(1)
eaxis(3, n.axp = 1)# -> xaxp[3] = 1: only 10^j (main) ticks
x <- lseq(.001, 0.1, length = 1000)
plot(x, sin(1/x)*x, type = "l", xaxt = "n", log = "x")
eaxis(1)
eaxis(3, n.axp = 1)# -> xaxp[3] = 1: only 10^j (main) ticks
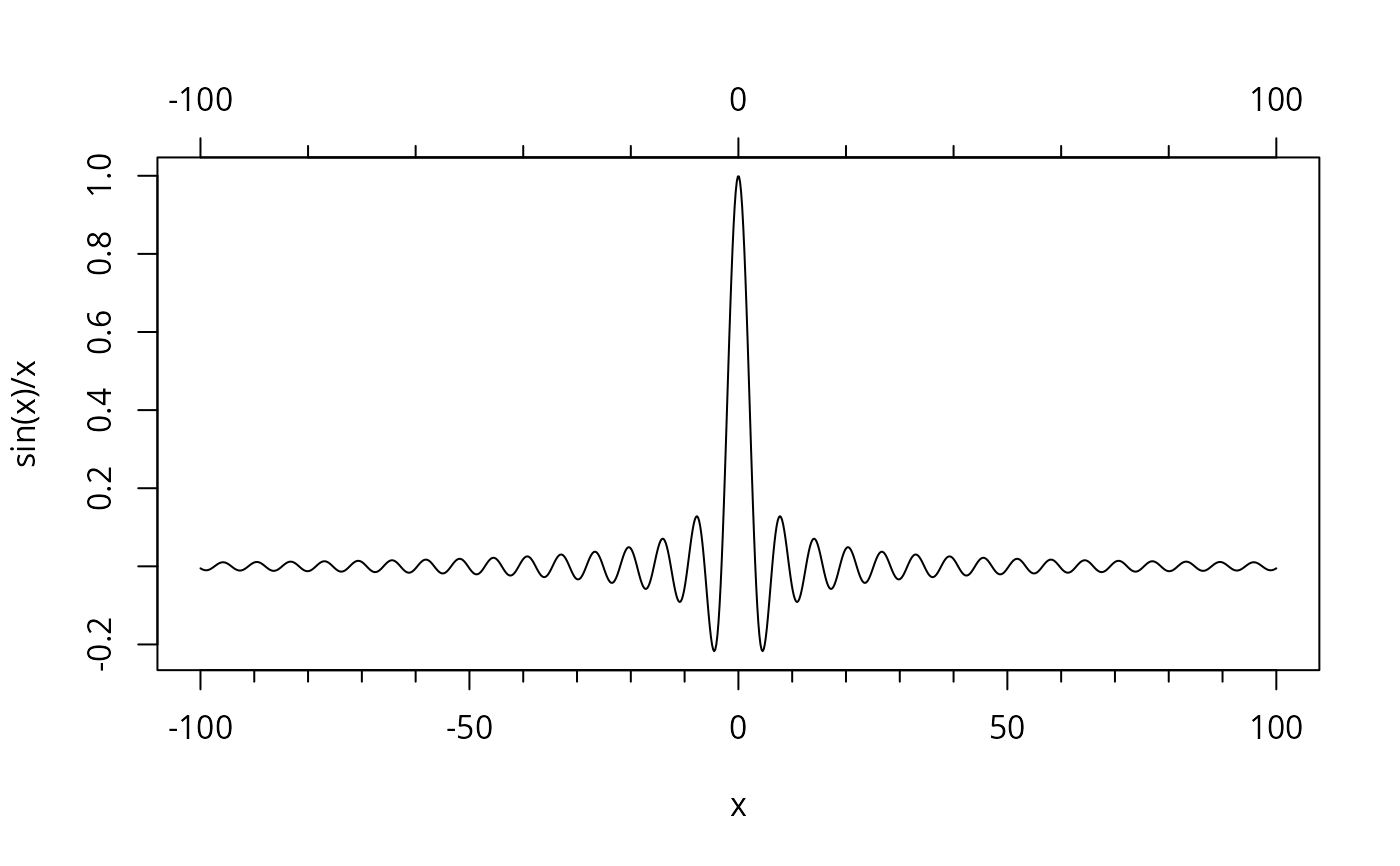
 ## non- log-scale : draw small ticks, but no "10^k" if not needed:
x <- seq(-100, 100, length = 1000)
plot(x, sin(x)/x, type = "l", xaxt = "n")
eaxis(1) # default -> {1, 2, 5} * 10^j ticks
eaxis(3, n.axp = 2)# -> xaxp[3] := 2 -- approximately two (main) ticks
## non- log-scale : draw small ticks, but no "10^k" if not needed:
x <- seq(-100, 100, length = 1000)
plot(x, sin(x)/x, type = "l", xaxt = "n")
eaxis(1) # default -> {1, 2, 5} * 10^j ticks
eaxis(3, n.axp = 2)# -> xaxp[3] := 2 -- approximately two (main) ticks
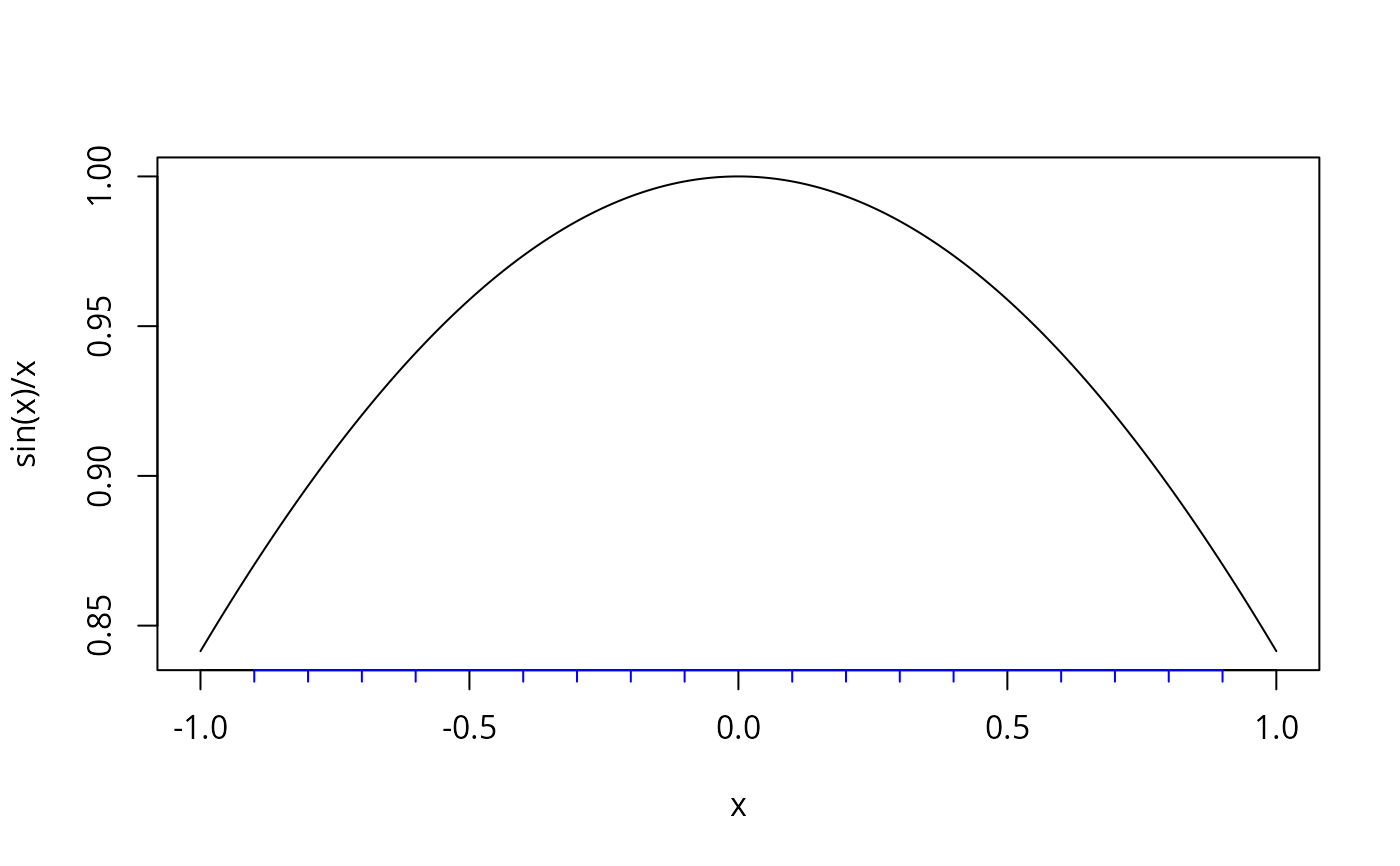
 x <- seq(-1, 1, length = 1000)
plot(x, sin(x)/x, type = "l", xaxt = "n")
eaxis(1, small.args = list(col="blue"))
x <- seq(-1, 1, length = 1000)
plot(x, sin(x)/x, type = "l", xaxt = "n")
eaxis(1, small.args = list(col="blue"))
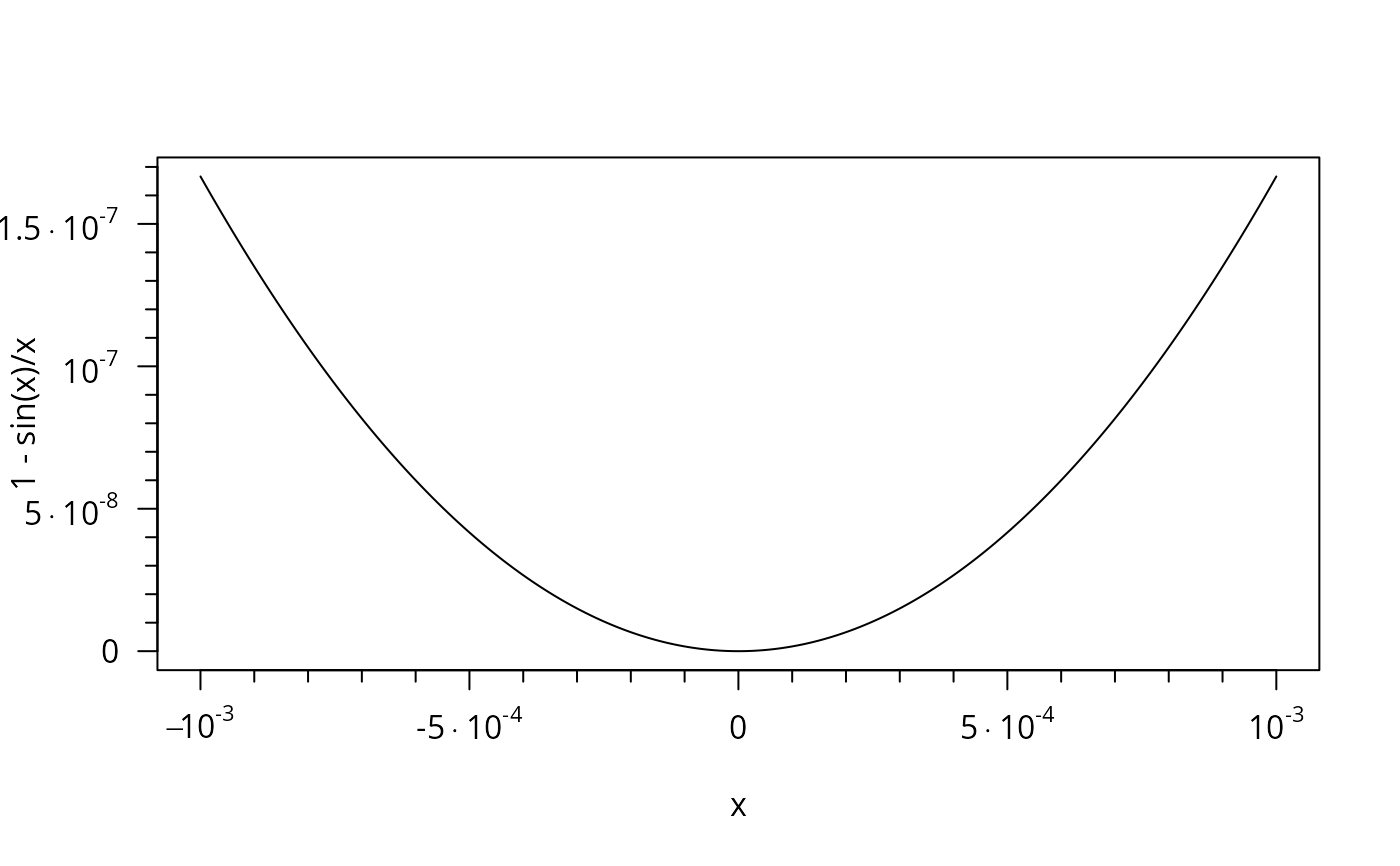
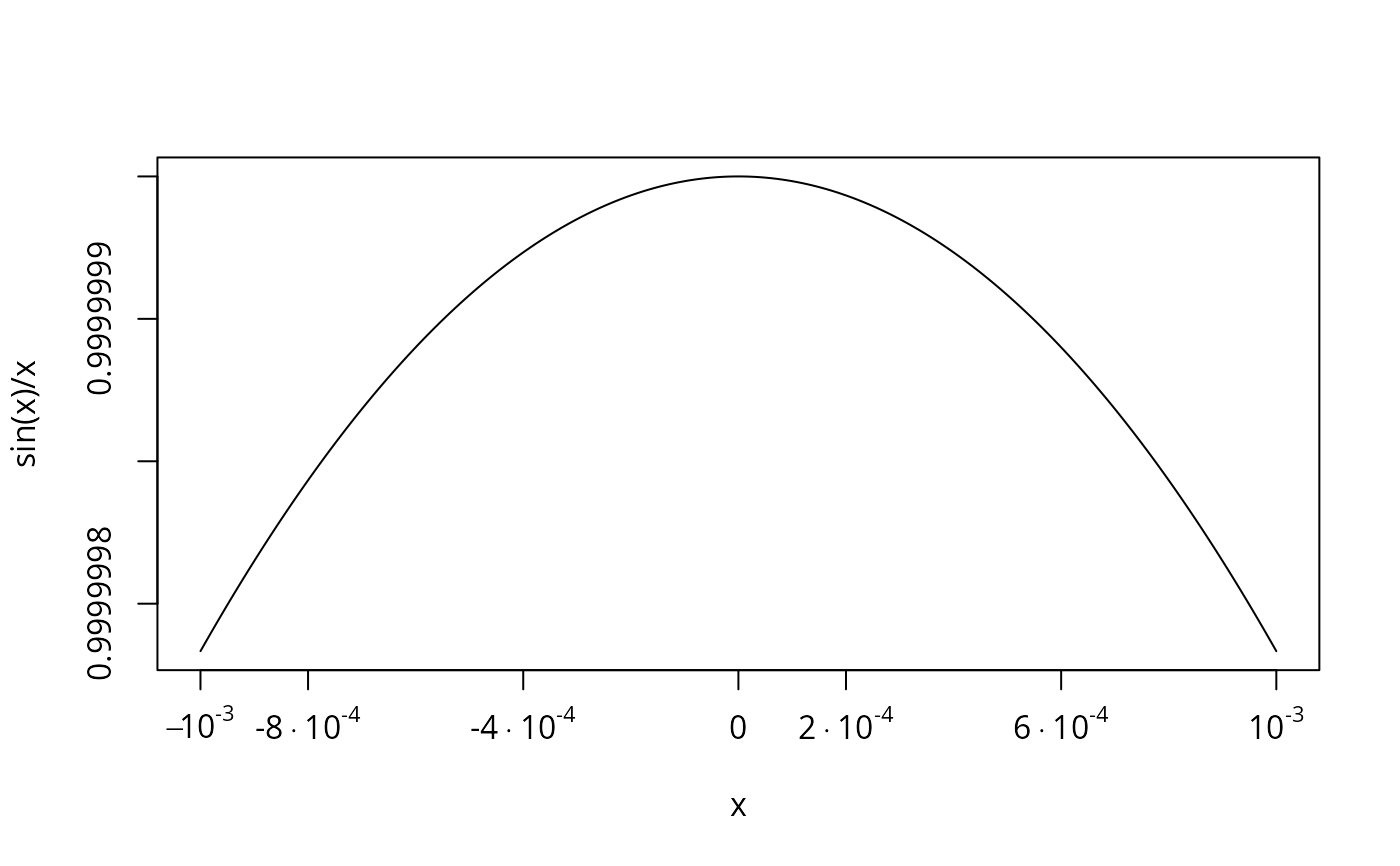
 x <- x/1000
plot(x, 1-sin(x)/x, type = "l", xaxt = "n", yaxt = "n")
eaxis(1)
eaxis(2)
x <- x/1000
plot(x, 1-sin(x)/x, type = "l", xaxt = "n", yaxt = "n")
eaxis(1)
eaxis(2)
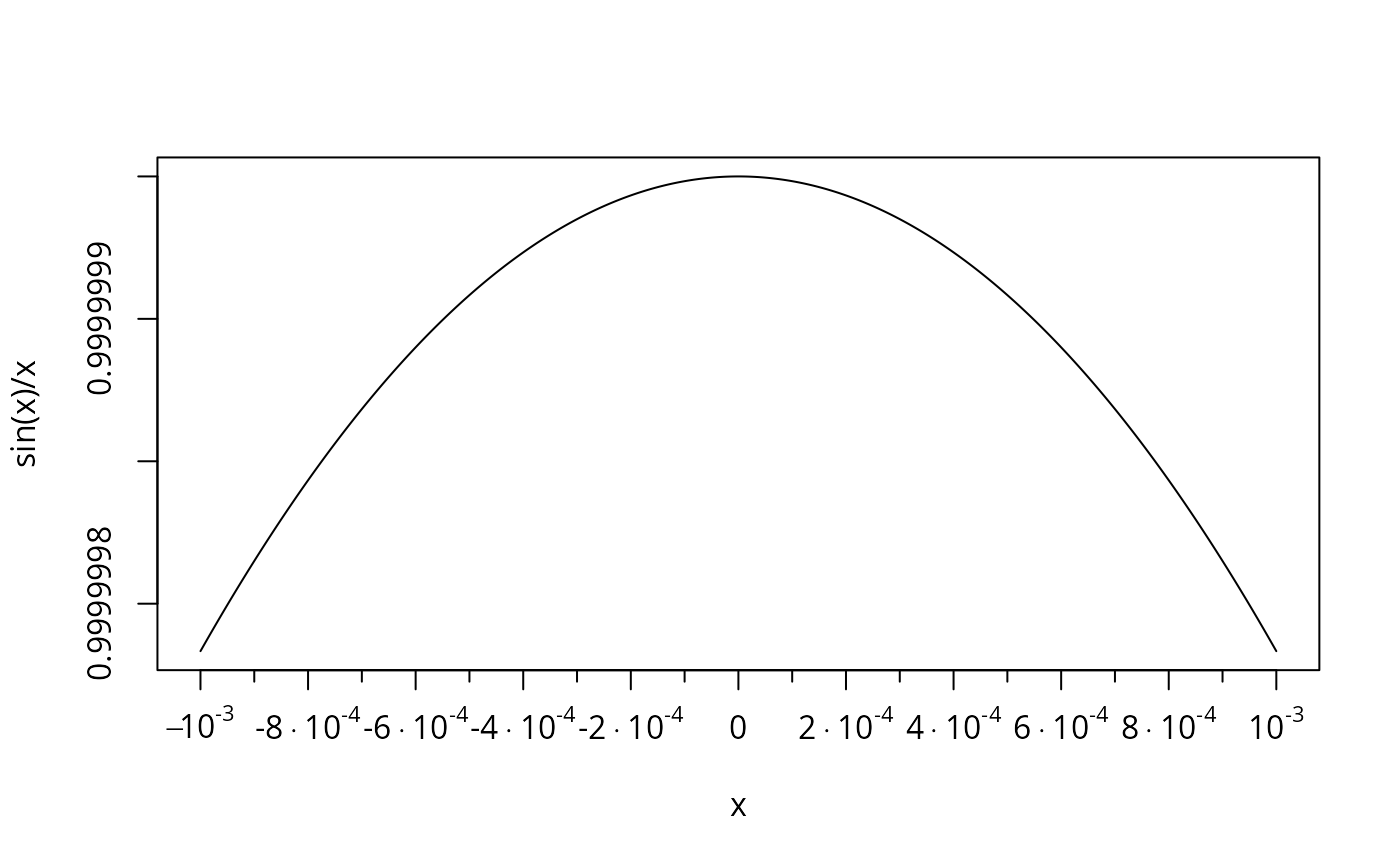
 ## more labels than default:
op <- par(lab=c(10,5,7))
plot(x, sin(x)/x, type = "l", xaxt = "n")
eaxis(1) # maybe (depending on your canvas), there are too many,
## more labels than default:
op <- par(lab=c(10,5,7))
plot(x, sin(x)/x, type = "l", xaxt = "n")
eaxis(1) # maybe (depending on your canvas), there are too many,
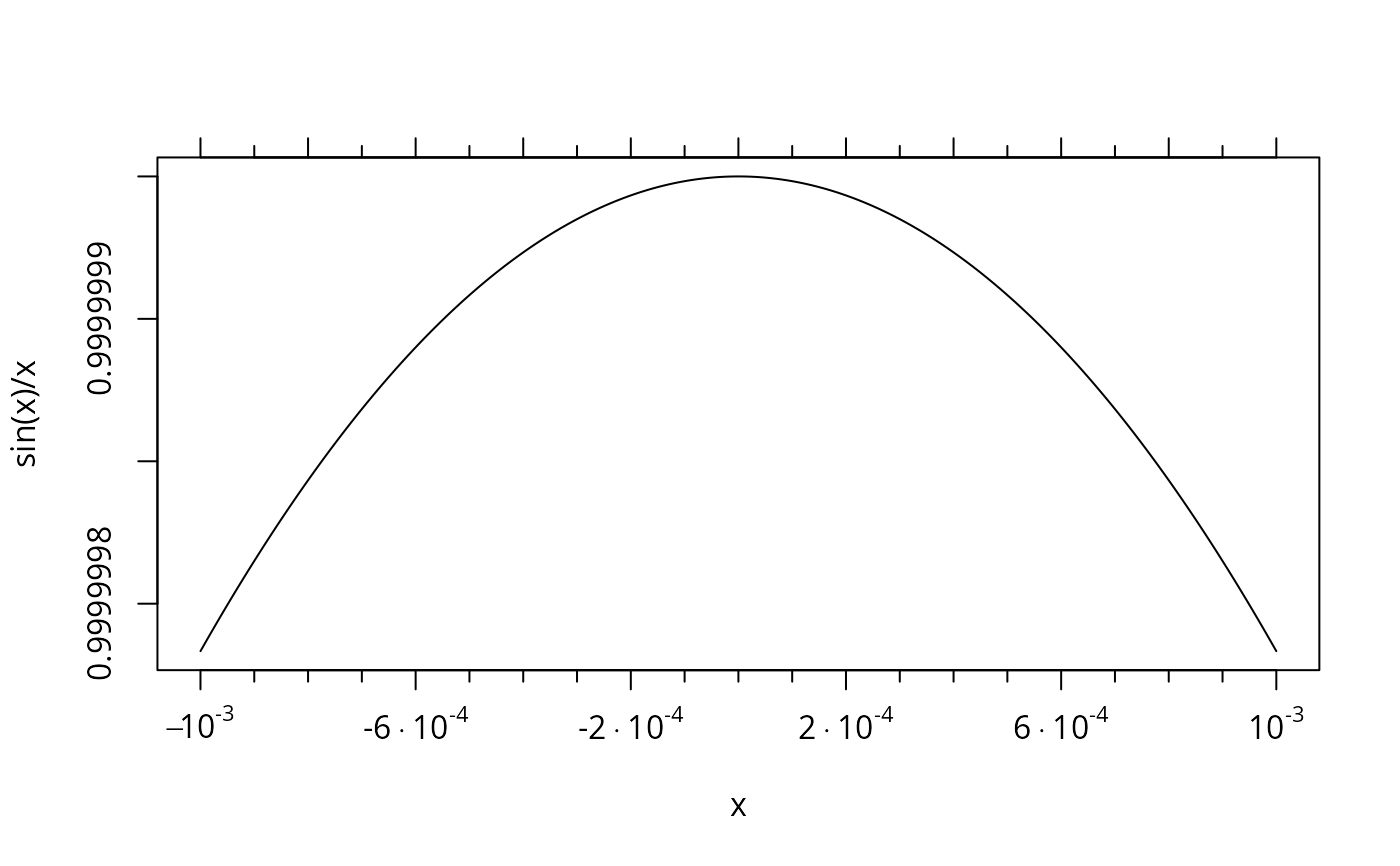
 ## in that case, maybe use
plot(x, sin(x)/x, type = "l", xaxt = "n")
eaxis(1, axTicks(1)[c(TRUE,FALSE)]) # drop every 2nd label
eaxis(3, labels=FALSE)
## in that case, maybe use
plot(x, sin(x)/x, type = "l", xaxt = "n")
eaxis(1, axTicks(1)[c(TRUE,FALSE)]) # drop every 2nd label
eaxis(3, labels=FALSE)
 ## ore use 'max.at' which thins as well:
plot(x, sin(x)/x, type = "l", xaxt = "n")
eaxis(1, max.at=6)
## ore use 'max.at' which thins as well:
plot(x, sin(x)/x, type = "l", xaxt = "n")
eaxis(1, max.at=6)
 par(op)
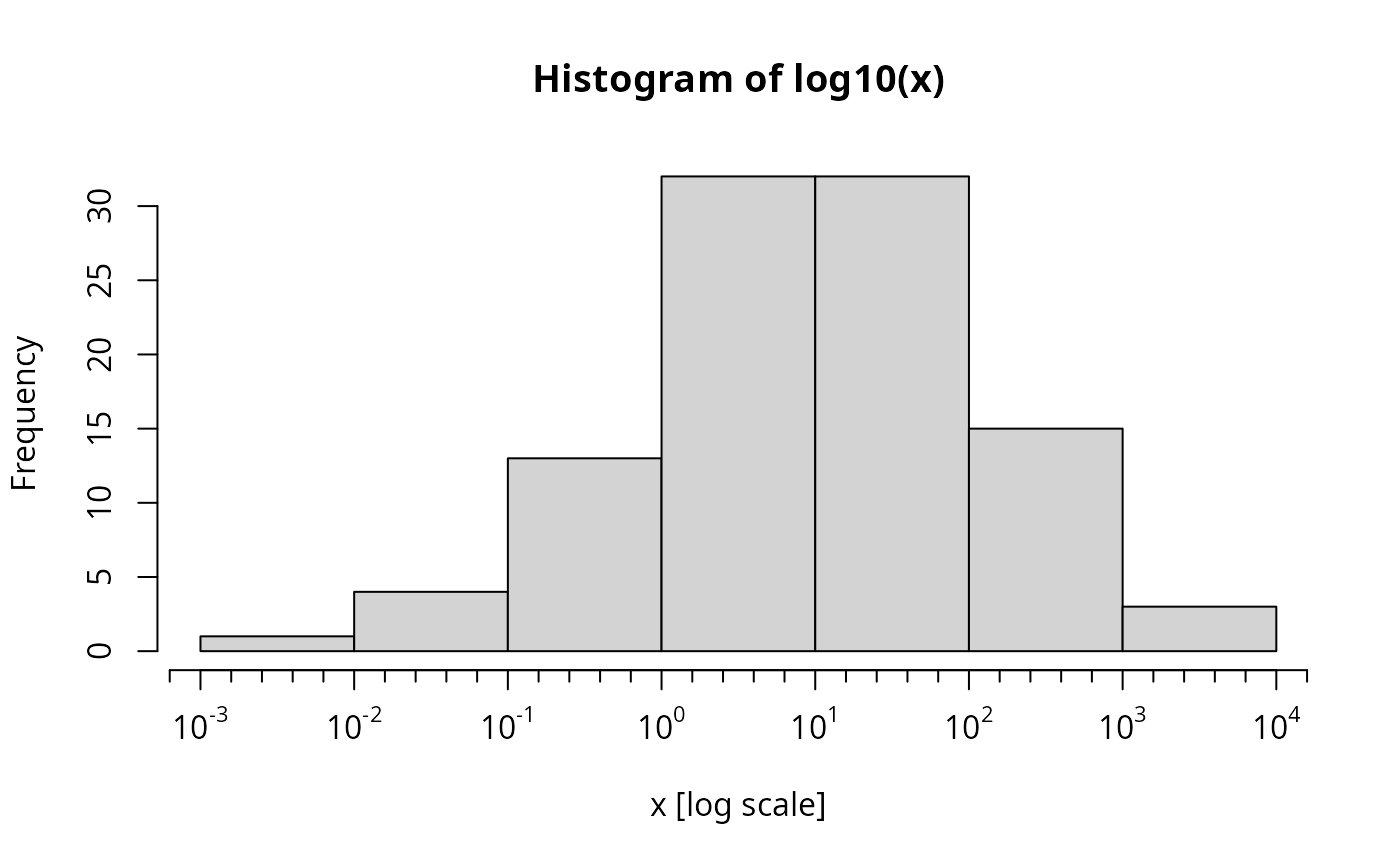
### Answering R-help "How do I show real values on a log10 histogram", 26 Mar 2013
## the data:
set.seed(1); summary(x <- rlnorm(100, m = 2, sdl = 3))
#> Min. 1st Qu. Median Mean 3rd Qu. Max.
#> 0.0096 1.6831 10.4717 248.6387 58.8317 9945.2794
## the plot (w/o x-axis) :
r <- hist(log10(x), xaxt = "n", xlab = "x [log scale]")
## the nice axis:
axt <- axTicks(1)
eaxis(1, at = axt, labels = pretty10exp(10^axt, drop.1=TRUE))
par(op)
### Answering R-help "How do I show real values on a log10 histogram", 26 Mar 2013
## the data:
set.seed(1); summary(x <- rlnorm(100, m = 2, sdl = 3))
#> Min. 1st Qu. Median Mean 3rd Qu. Max.
#> 0.0096 1.6831 10.4717 248.6387 58.8317 9945.2794
## the plot (w/o x-axis) :
r <- hist(log10(x), xaxt = "n", xlab = "x [log scale]")
## the nice axis:
axt <- axTicks(1)
eaxis(1, at = axt, labels = pretty10exp(10^axt, drop.1=TRUE))
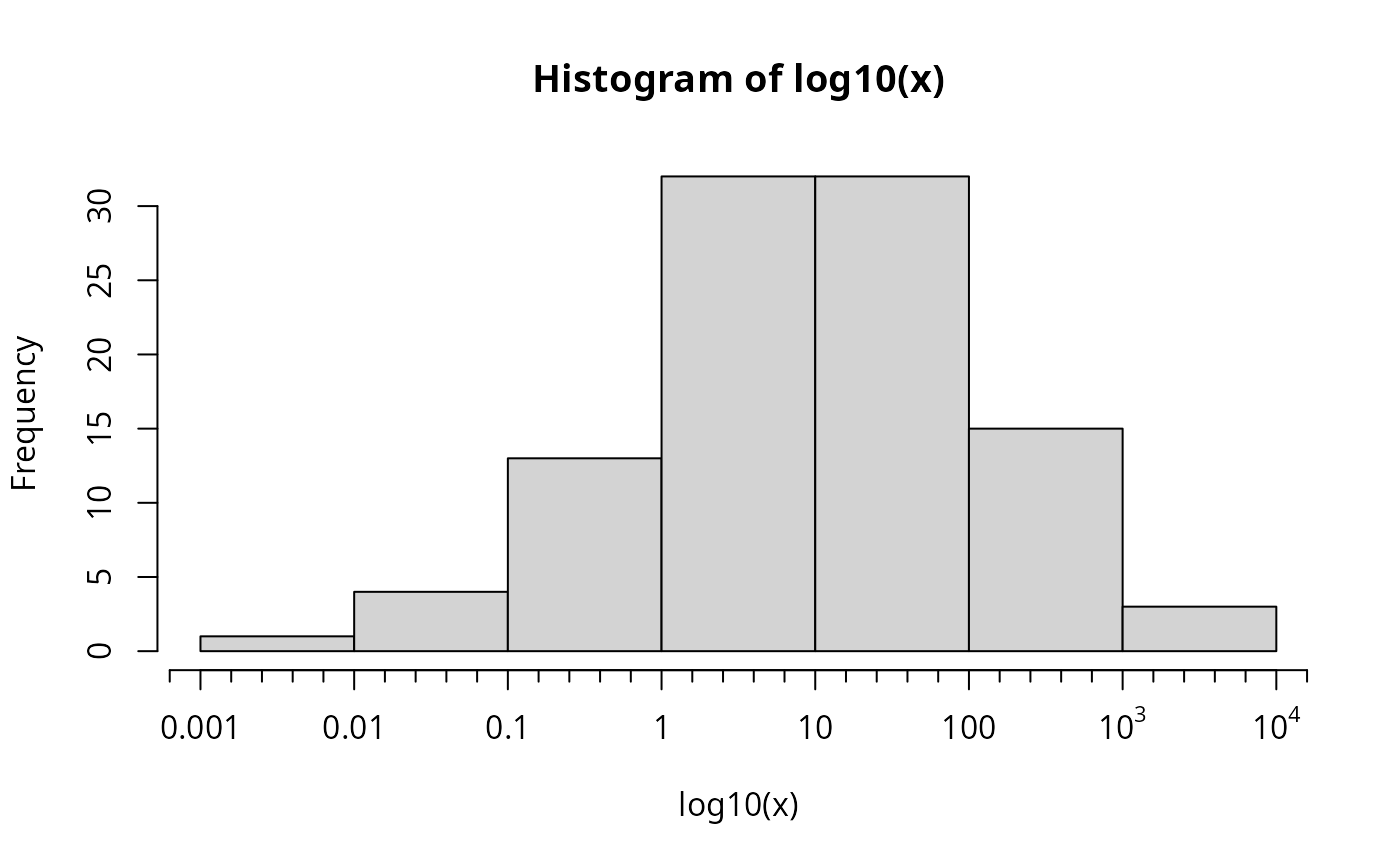
 ## Additionally demo'ing 'sub10' options:
plot(r, xaxt="n")
eaxis(1, at = axt, labels = pretty10exp(10^axt, drop.1=TRUE, sub10 = 2))
## Additionally demo'ing 'sub10' options:
plot(r, xaxt="n")
eaxis(1, at = axt, labels = pretty10exp(10^axt, drop.1=TRUE, sub10 = 2))
 ## or
plot(r, xaxt="n")
eaxis(1, at = axt, labels = pretty10exp(10^axt, drop.1=TRUE, sub10 = "10"))
## or
plot(r, xaxt="n")
eaxis(1, at = axt, labels = pretty10exp(10^axt, drop.1=TRUE, sub10 = "10"))
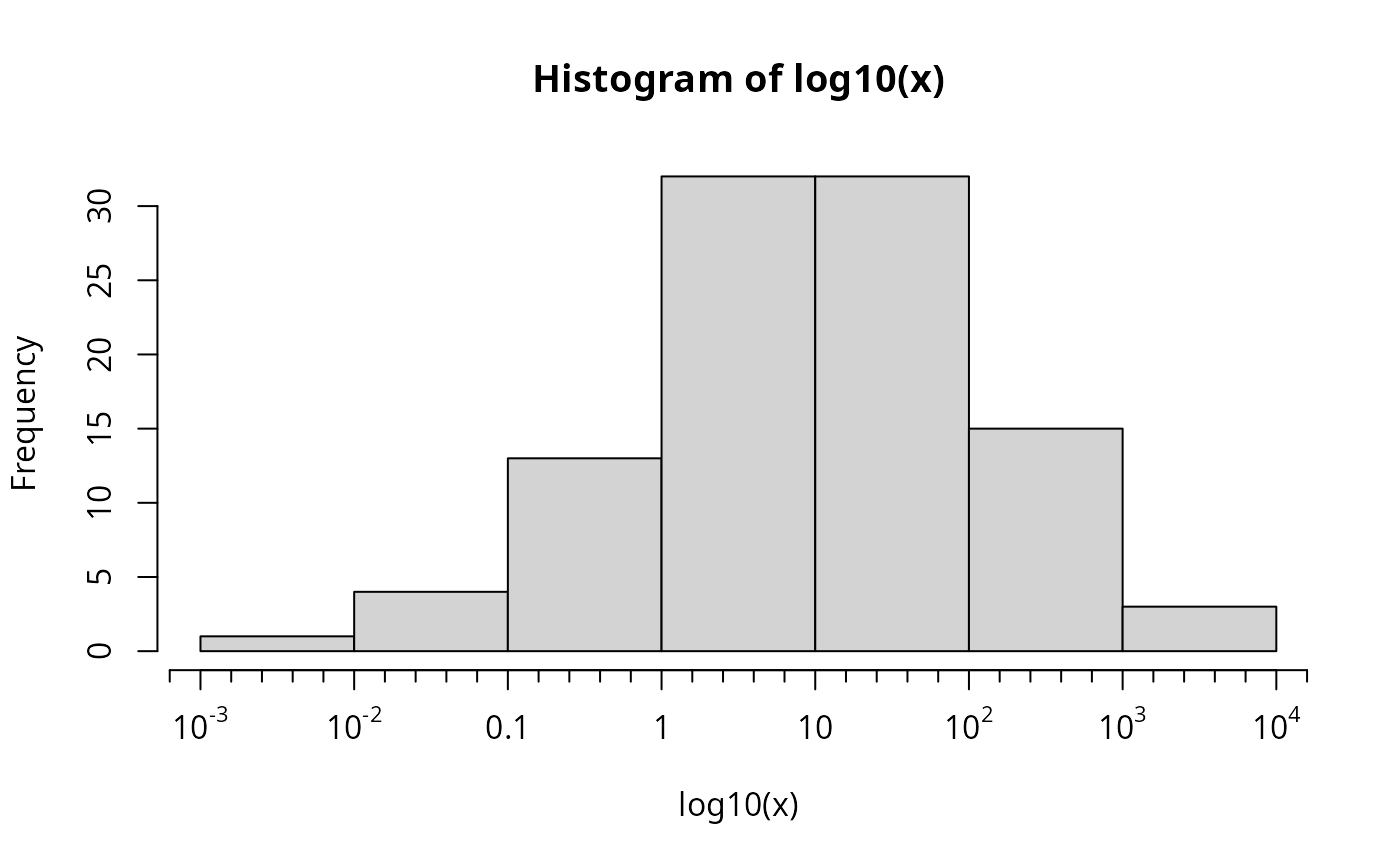 ## or
plot(r, xaxt="n")
eaxis(1, at = axt, labels = pretty10exp(10^axt, drop.1=TRUE, sub10 = c(-2, 2)))
## or
plot(r, xaxt="n")
eaxis(1, at = axt, labels = pretty10exp(10^axt, drop.1=TRUE, sub10 = c(-2, 2)))
