Plot Confidence or Prediction Hyperbolas around a Regression Line
linesHyberb.lm.RdAdd confidence/prediction hyperbolas for \(y(x_0)\) to a plot with data or regression line.
Usage
linesHyperb.lm(object, c.prob=0.95, confidence=FALSE,
            k=if (confidence) Inf else 1,
            col=2, lty=2, do.abline=TRUE)
Arguments
- object
result of
lm(.).- c.prob
coverage probability in \((0,1)\).
- confidence
logical; if true, do (small) confidence band, else, realistic prediction band for the mean of
kobservations.- k
integer or
Inf; assumekfuture observations;k = Infcorresponds to confidence intervals (for y).- col, lty
attributes for the
linesto be drawn.- do.abline
logical; if true, the regression line is drawn as well.
Note
With predict.lm(*, interval=) is available,
this function linesHyperb.lm is only slightly more general for
its k argument.
See also
predict.lm(*, interval=) optionally computes
prediction or confidence intervals.
Examples
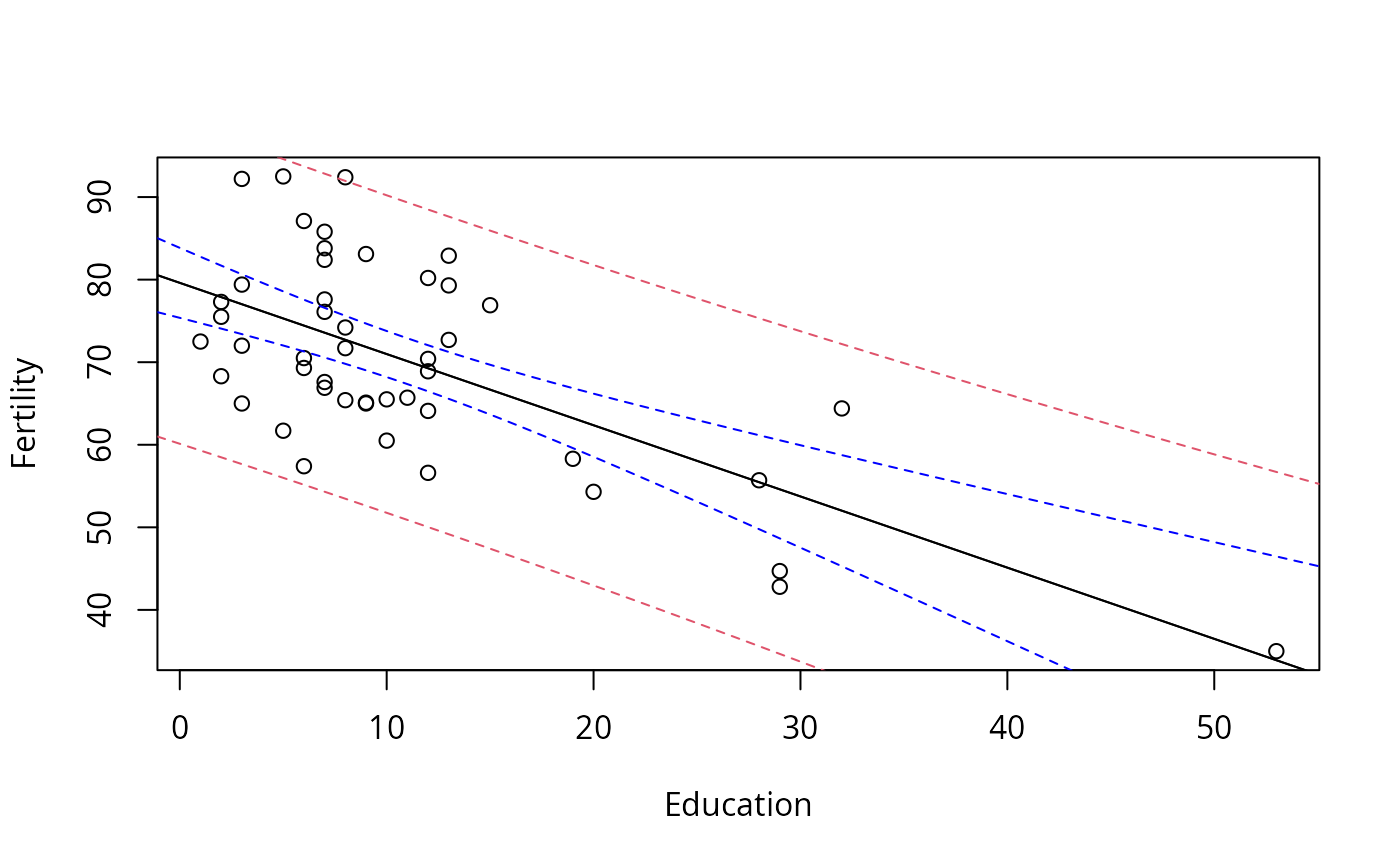
data(swiss)
      plot(Fertility ~ Education, data = swiss) # the data
(lmS <- lm(Fertility ~ Education, data = swiss))
#>
#> Call:
#> lm(formula = Fertility ~ Education, data = swiss)
#>
#> Coefficients:
#> (Intercept)    Education
#>     79.6101      -0.8624
#>
linesHyperb.lm(lmS)
linesHyperb.lm(lmS, conf=TRUE, col="blue")