Simple Matrix Plots
mpl.RdDo simple matrix plots, providing an easy interface to
matplot by using a default x variable.
Arguments
- mat
numeric matrix.
- ...
further arguments passed to
matplot, e.g.,type,xlab, etc.
Details
p.m(m) use the first column of m as \(x\) variable,
whereas mpl(m) uses the integers 1, 2, ..., nrow(m)
as coordinates and rownames(m) as axis labels if possible.
Note
These were really created for playing around with curves etc, and
probably should be deprecated since in concrete examples, using
matplot() directly is more appropriate.
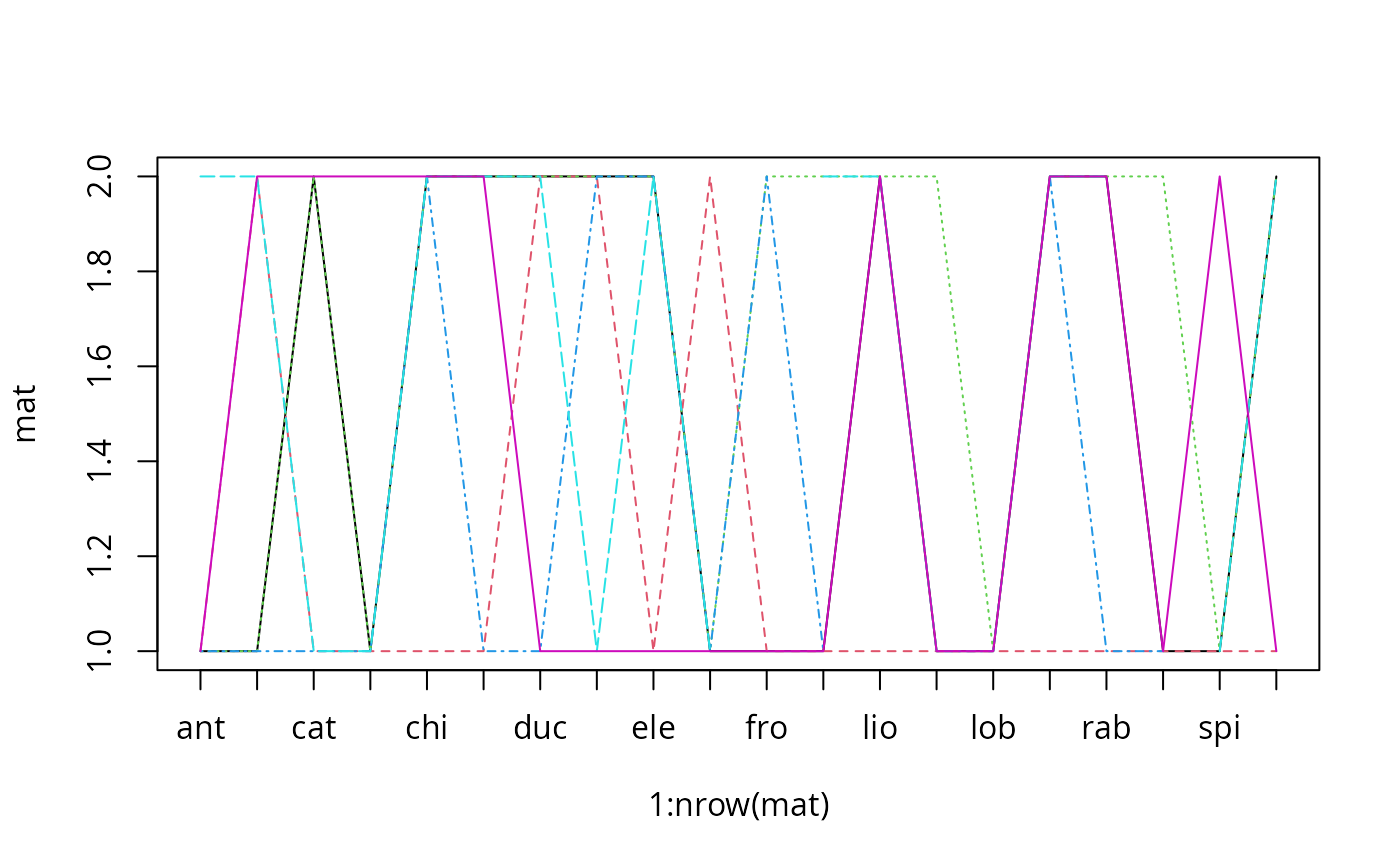
Examples
data(animals, package = "cluster")
mpl(animals, type = "l")