Plot Setup for MULTiple FIGures, incl. Main Title
mult.fig.RdEasy Setup for plotting multiple figures (in a rectangular layout) on
one page. It allows to specify a main title and uses smart
defaults for several par calls.
Usage
mult.fig(nr.plots, mfrow, mfcol, marP = rep(0, 4),
         mgp = c(if(par("las") != 0) 2. else 1.5, 0.6, 0),
         mar = marP + 0.1 + c(4,4,2,1), oma = c(0,0, tit.wid, 0),
         main = NULL,
         tit.wid = if (is.null(main)) 0 else 1 + 1.5*cex.main,
         cex.main = par("cex.main"), line.main = cex.main - 1/2,
         col.main = par("col.main"), font.main = par("font.main"), ...)
Arguments
- nr.plots
integer; the number of plot figures you'll want to draw.
- mfrow, mfcol
instead of
nr.plots: integer(2) vectors giving the rectangular figure layout forpar(mfrow = *), orpar(mfcol=*), respectively. The default is to usemfrow = n2mfrow(nr.plots).- marP
numeric(4) vector of figure margins to add (“Plus”) to default
mar, see below.- mgp
argument for
par(mpg= .)with a smaller default than usual.- mar
argument for
par(mar= .)with a smaller default than usual, using themarPargument, see above.- oma
argument for
par(oma= .), by default for adding space for themaintitle if necessary.- main
character. The main title to be used for the whole graphic.
- tit.wid
numeric specifying the vertical width to be used for the main title; note that this is only used for the default value of
oma(s. above).- cex.main
numeric; the character size to be used for the main title.
- line.main
numeric; the margin line at which the title is written (via
mtext(main, side=3, outer=TRUE, line = line.main, ....)).- col.main, font.main
color and font for main title, passed to
mtext(), see alsopar(*).- ...
further arguments to
mtextfor the main title.
Value
A list with two components that are lists themselves, a
subset of par(),
- new.par
the current
parsettings.- old.par
the
parbefore the call.
Examples
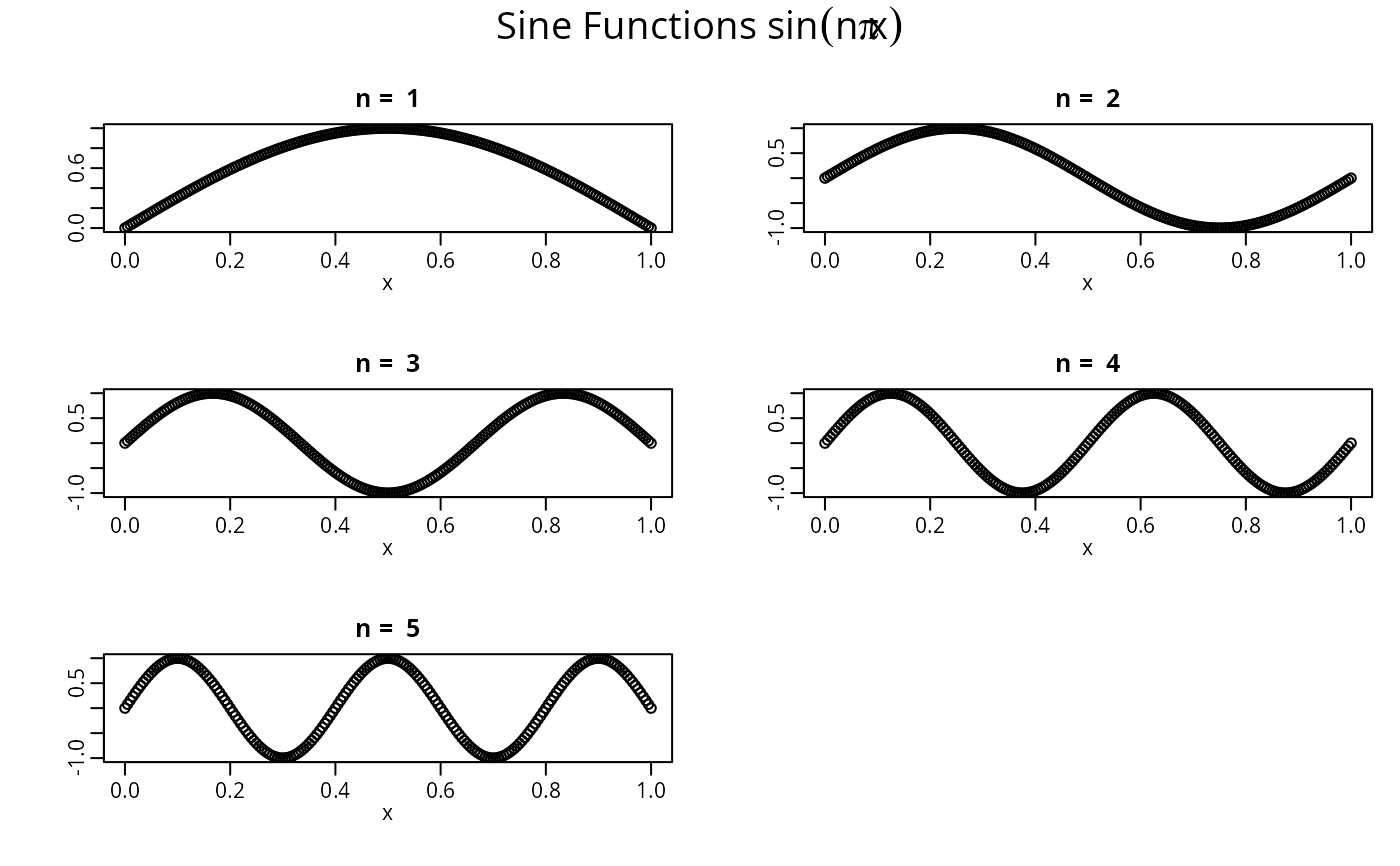
opl <- mult.fig(5, main= expression("Sine Functions " * sin(n * pi * x)))
x <- seq(0, 1, len = 201)
for (n in 1:5)
plot(x, sin(n * pi * x), ylab ="", main = paste("n = ",n))
par(opl$old.par)
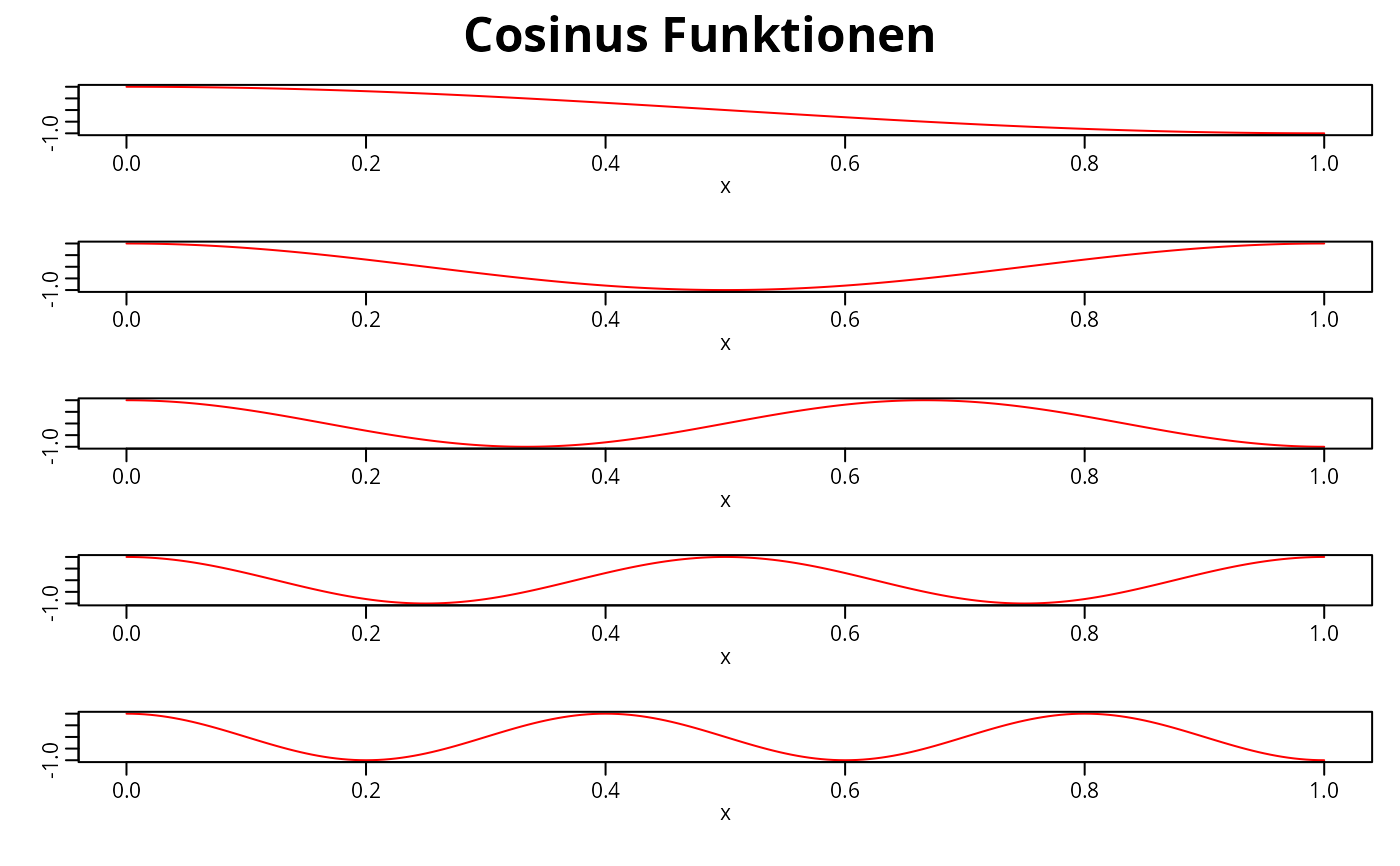
 rr <- mult.fig(mfrow=c(5,1), main= "Cosinus Funktionen", cex = 1.5,
marP = - c(0, 1, 2, 0))
for (n in 1:5)
plot(x, cos(n * pi * x), type = 'l', col="red", ylab ="")
rr <- mult.fig(mfrow=c(5,1), main= "Cosinus Funktionen", cex = 1.5,
marP = - c(0, 1, 2, 0))
for (n in 1:5)
plot(x, cos(n * pi * x), type = 'l', col="red", ylab ="")
 str(rr)
#> List of 2
#> $ new.par:List of 5
#> ..$ mfrow: int [1:2] 5 1
#> ..$ mfcol: int [1:2] 5 1
#> ..$ oma : num [1:4] 0 0 3.25 0
#> ..$ mar : num [1:4] 4.1 3.1 0.1 1.1
#> ..$ mgp : num [1:3] 1.5 0.6 0
#> $ old.par:List of 4
#> ..$ mfrow: int [1:2] 1 1
#> ..$ oma : num [1:4] 0 0 0 0
#> ..$ mar : num [1:4] 5.1 4.1 4.1 2.1
#> ..$ mgp : num [1:3] 3 1 0
par(rr$old.par)
## The *restored* par settings:
str(do.call("par", as.list(names(rr$new.par))))
#> List of 5
#> $ mfrow: int [1:2] 1 1
#> $ mfcol: int [1:2] 1 1
#> $ oma : num [1:4] 0 0 0 0
#> $ mar : num [1:4] 5.1 4.1 4.1 2.1
#> $ mgp : num [1:3] 3 1 0
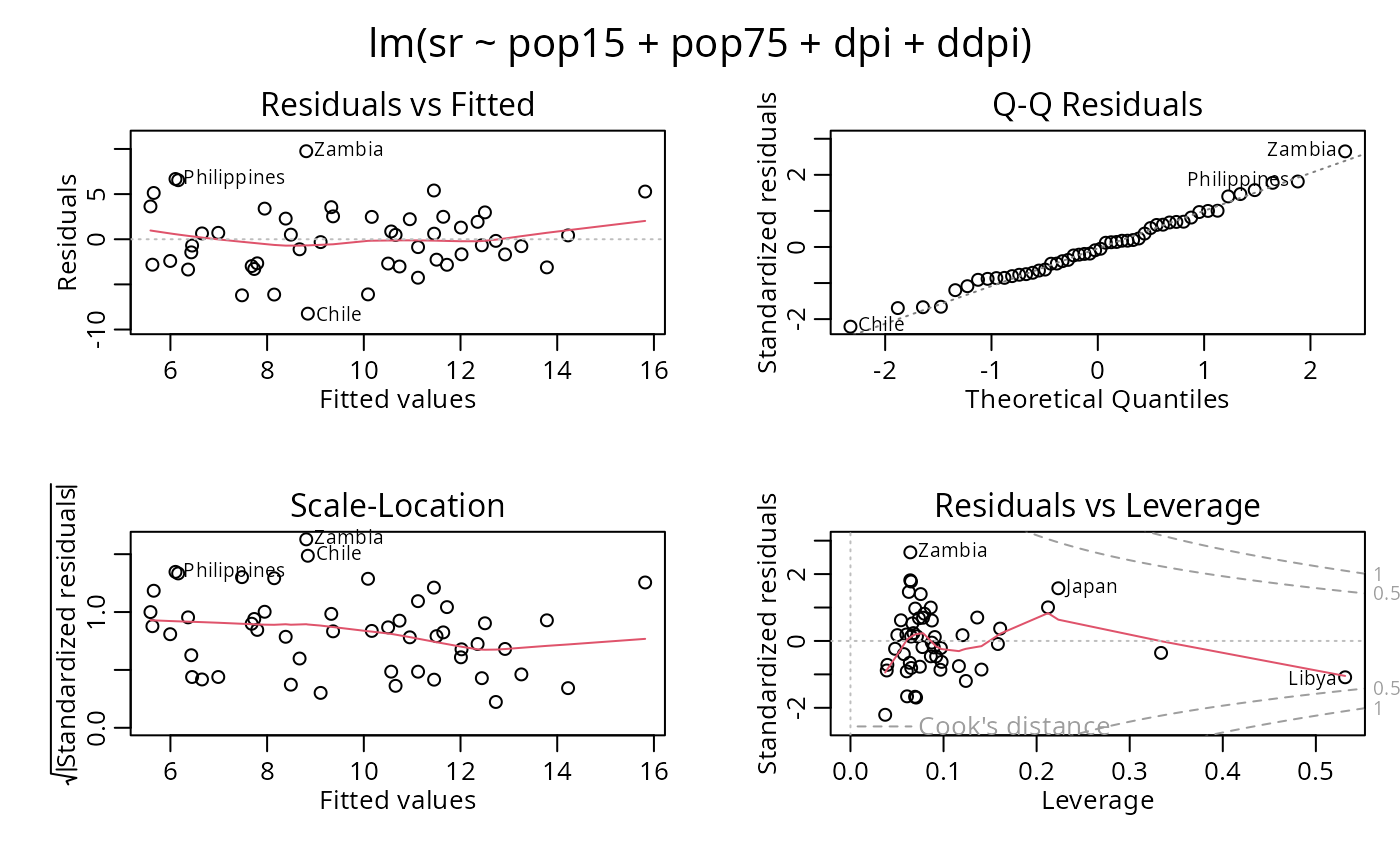
## Manual setting of `tit.wid` in case subsequent code also manages par():
mult.fig(4, tit.wid = 2)$old.par -> opar
plot(lm(sr ~ pop15 + pop75 + dpi + ddpi, data = LifeCycleSavings))
str(rr)
#> List of 2
#> $ new.par:List of 5
#> ..$ mfrow: int [1:2] 5 1
#> ..$ mfcol: int [1:2] 5 1
#> ..$ oma : num [1:4] 0 0 3.25 0
#> ..$ mar : num [1:4] 4.1 3.1 0.1 1.1
#> ..$ mgp : num [1:3] 1.5 0.6 0
#> $ old.par:List of 4
#> ..$ mfrow: int [1:2] 1 1
#> ..$ oma : num [1:4] 0 0 0 0
#> ..$ mar : num [1:4] 5.1 4.1 4.1 2.1
#> ..$ mgp : num [1:3] 3 1 0
par(rr$old.par)
## The *restored* par settings:
str(do.call("par", as.list(names(rr$new.par))))
#> List of 5
#> $ mfrow: int [1:2] 1 1
#> $ mfcol: int [1:2] 1 1
#> $ oma : num [1:4] 0 0 0 0
#> $ mar : num [1:4] 5.1 4.1 4.1 2.1
#> $ mgp : num [1:3] 3 1 0
## Manual setting of `tit.wid` in case subsequent code also manages par():
mult.fig(4, tit.wid = 2)$old.par -> opar
plot(lm(sr ~ pop15 + pop75 + dpi + ddpi, data = LifeCycleSavings))
 par(opar) # reset