Plot Parametric Density Functions
p.dnorm.RdThese are utilities for pretty plotting of often used parametric densities.
Usage
p.dnorm (mu = 0, s = 1, h0.col = "light gray",
         ms.lines = TRUE, ms.col = "gray", ...)
p.dchisq(nu,    h0.col = "light gray", ...)
p.dgamma(shape, h0.col = "light gray", ...)
Arguments
- mu,s
numbers, the mean and standard deviation of the normal distribution.
- nu
positive number, the degrees of freedom
dfargument for the \(\chi^2\)-density functiondchisq.- shape
number, the
shapeparameter for the Gamma distribution.- h0.col
color specification for the line \(y = 0\).
- ms.lines
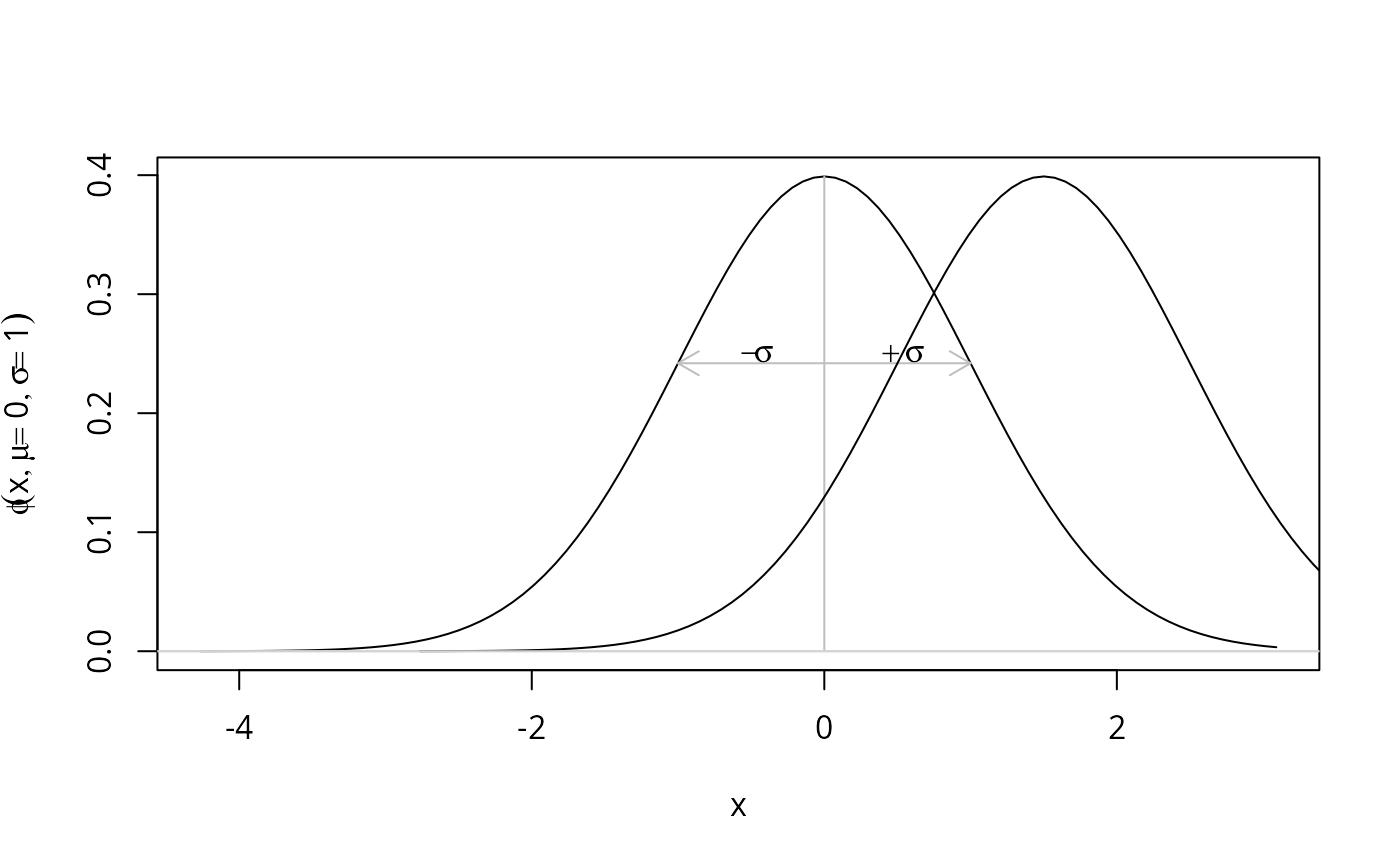
logical, used for the normal only: should lines be drawn at the mean and \(\pm\) 1 standard deviation.
- ms.col
color for the
mslines ifms.linesis TRUE.- ...
further parameter passed to
curve(), e.g.,add = TRUEfor adding to current plot.
Examples
p.dnorm()
p.dnorm(mu=1.5, add = TRUE, ms.lines = FALSE) # add to the plot above
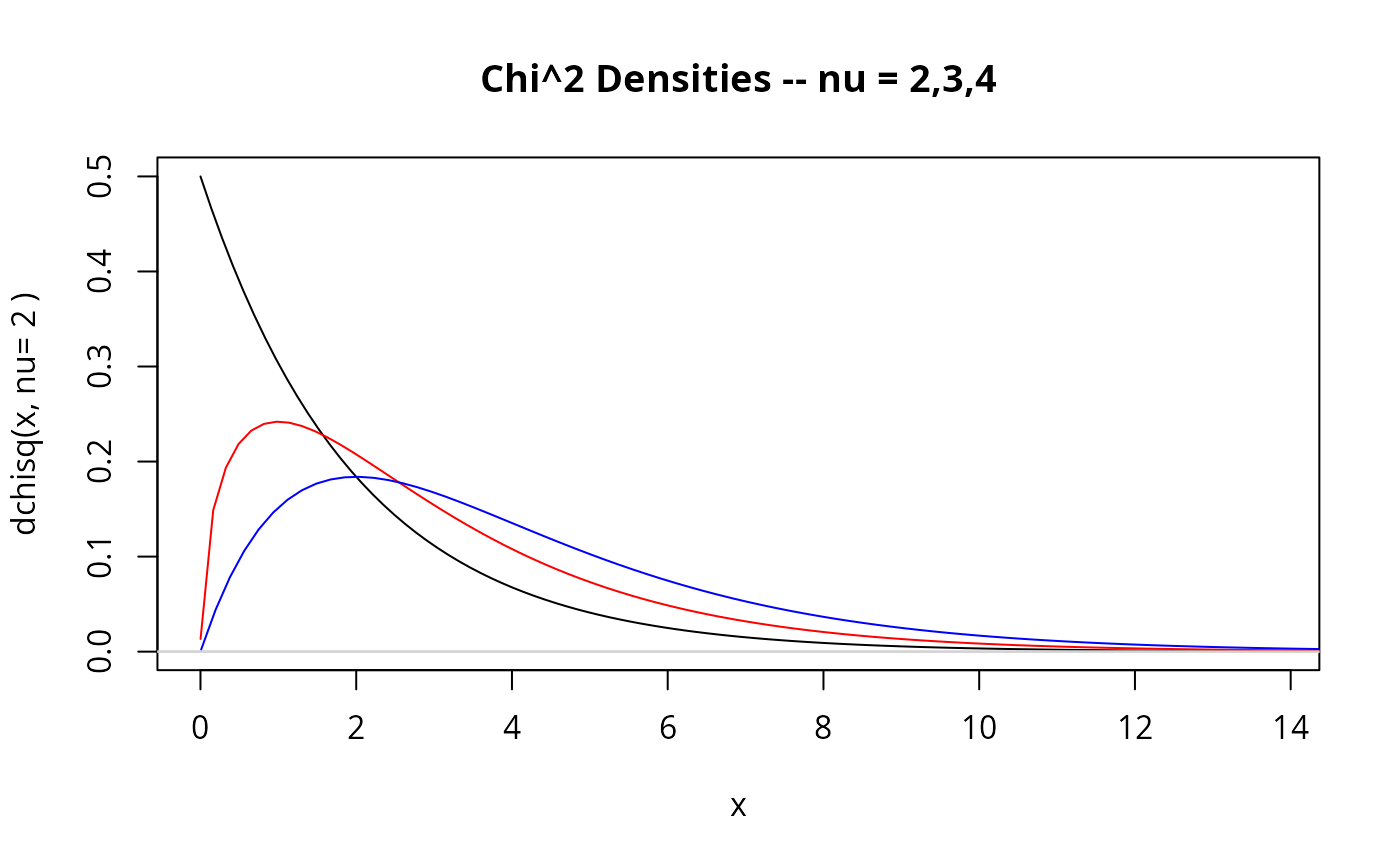
 p.dchisq(2, main= "Chi^2 Densities -- nu = 2,3,4")
p.dchisq(3, add = TRUE, col = "red")
p.dchisq(4, add = TRUE, col = "blue")
p.dchisq(2, main= "Chi^2 Densities -- nu = 2,3,4")
p.dchisq(3, add = TRUE, col = "red")
p.dchisq(4, add = TRUE, col = "blue")
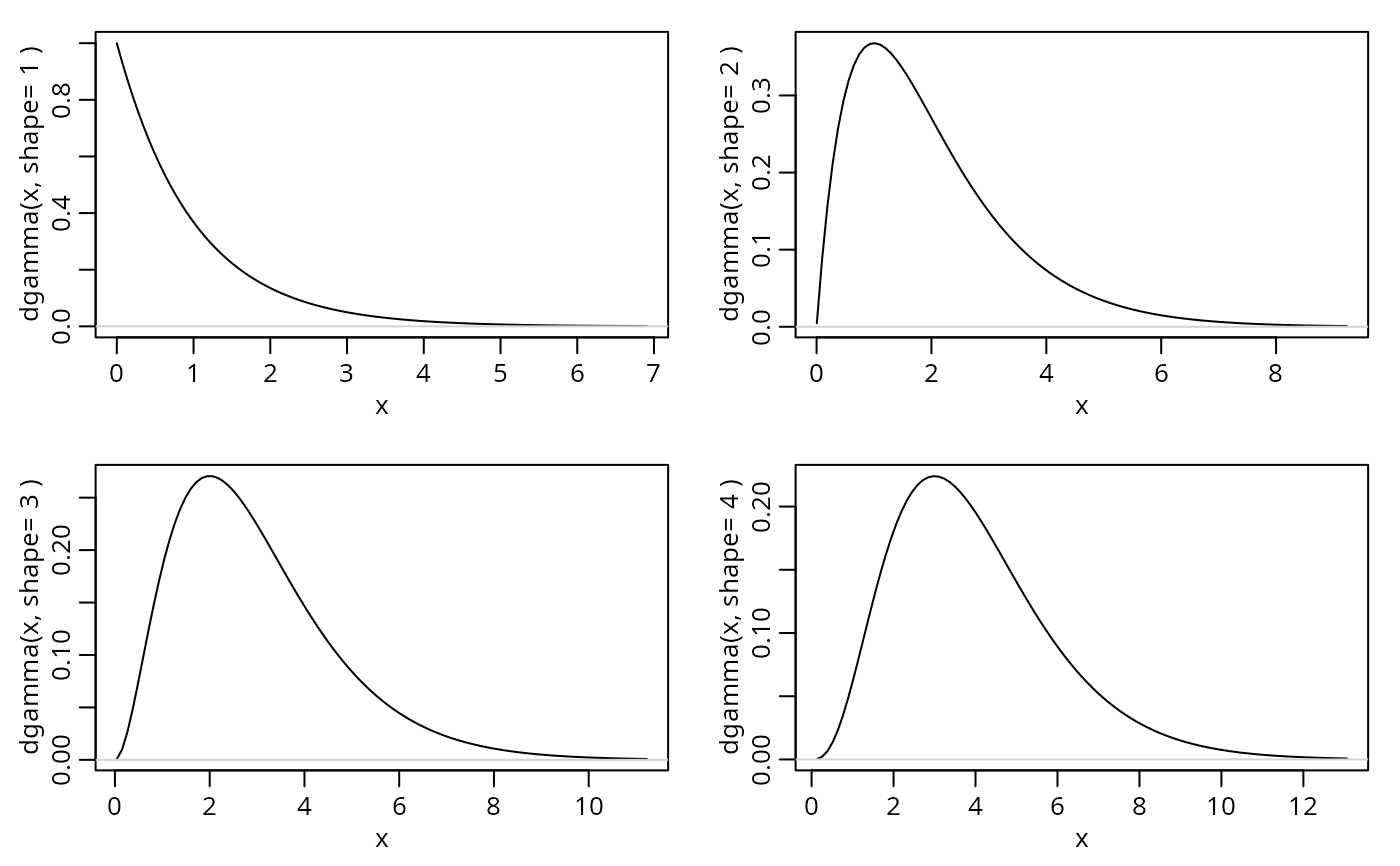
 op <- par(mfrow = c(2,2), mgp = c(1.6, 0.6,0), mar = c(3,3,1,1))
for(sh in 1:4)
p.dgamma(sh)
op <- par(mfrow = c(2,2), mgp = c(1.6, 0.6,0), mar = c(3,3,1,1))
for(sh in 1:4)
p.dgamma(sh)
 par(op)