Draw Symbol on a Plot
p.tachoPlot.RdPuts a symbol (pointer) on a plot at each of the specified locations.
Usage
p.tachoPlot(x, y, z, angle=c(pi/4,3*pi/4), size,
      method = c("robust", "sensitive", "rank"),
      legend = TRUE, show.method = legend,
      xlab = deparse(substitute(x)), ylab = deparse(substitute(y)),
      xlim, ylim, ...)
Arguments
- x,y,z
coordinates of points. Numeric vectors of the same length. Missing values (
NAs) are allowed.- angle
numeric vector whose elements give the angles between the horizontal baseline and the minimum and maximum direction of the pointer measured clockwise in radians.
- size
length of the pointers in cm.
- method
string specifying the method to calculate the angle of the pointer. One of
"sensitive","robust"or"rank". Only the first two characters are necessary.The minimum and maximum direction of the pointer corresponds to min(z) and max(z) if method is
"sensitive"or"rank"and to the upper and lower extreme of z if method is"robust"(seeboxplotorrrangefor details). The angle is proportional to z or rank(z) in case ofmethod="rank".- legend
logical flag: if
TRUE(default), a legend giving the values of the minimum and maximum direction of the pointer is drawn.- show.method
logical flag, defaulting to
legend; if true, the method name is printed.- xlab,ylab
labels for x and y axis; defaults to the ‘expression’ used in the function call.
- xlim,ylim
numeric of length 2, the limits for the x and y axis, respectively; see
plot.default.- ...
further arguments to
plot. Graphical parameters (seepar) may also be supplied as arguments to this function.
Details
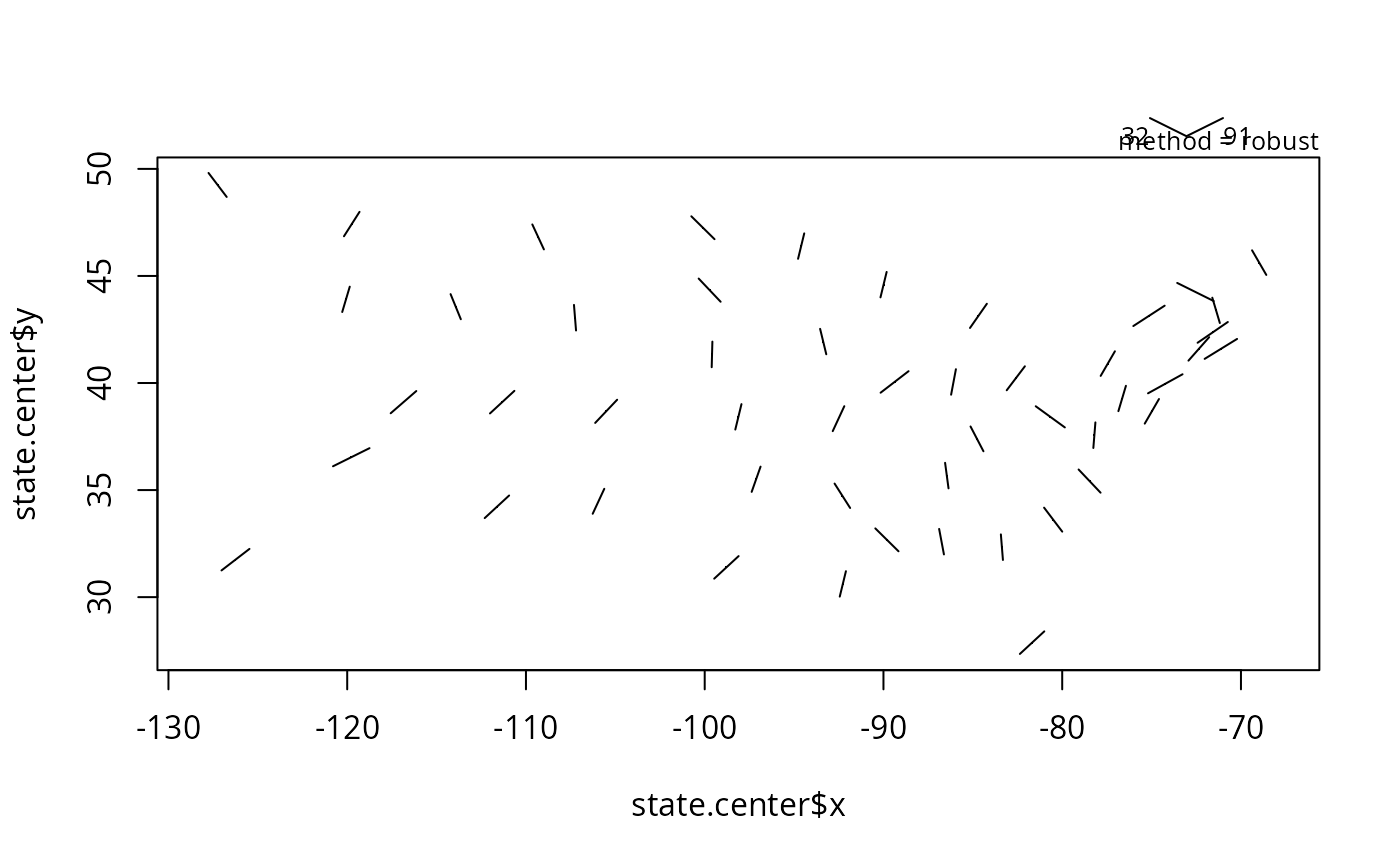
A scatter plot of the variables x and y is plotted. The value of the third variable z is given by the direction of a pointer (similar to a tachometer). Observations whose z-coordinate is missing are marked by a dot.
Examples
data(state)
data(USArrests)
p.tachoPlot(state.center $x, state.center $y, USArrests[,"UrbanPop"])
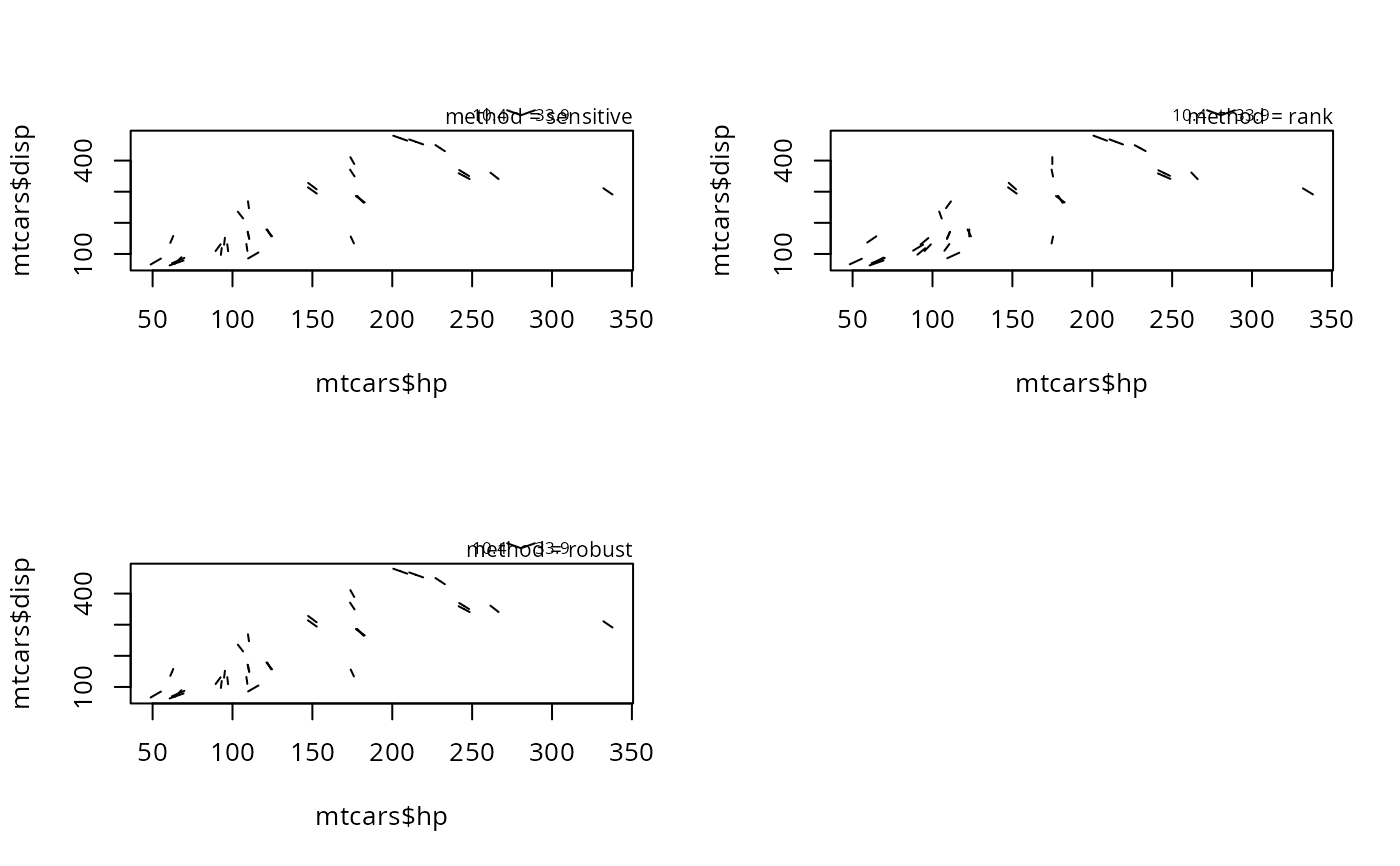
 data(mtcars)
par(mfrow=c(2,2))
## see the difference between the three methods (not much differ. here!)
p.tachoPlot(mtcars$hp, mtcars$disp, mtcars$mpg, method="sens")
p.tachoPlot(mtcars$hp, mtcars$disp, mtcars$mpg, method="rank")
p.tachoPlot(mtcars$hp, mtcars$disp, mtcars$mpg, method="rob")
data(mtcars)
par(mfrow=c(2,2))
## see the difference between the three methods (not much differ. here!)
p.tachoPlot(mtcars$hp, mtcars$disp, mtcars$mpg, method="sens")
p.tachoPlot(mtcars$hp, mtcars$disp, mtcars$mpg, method="rank")
p.tachoPlot(mtcars$hp, mtcars$disp, mtcars$mpg, method="rob")