Fisher's Potato Crop Data
potatoes.RdFisher's potato crop data set is of historical interest as an early example of a multi-factor block design.
Usage
data(potatoes)Format
A data frame with 64 observations on the following 5 variables.
- pos
a factor with levels
1:4.- treat
a factor with 16 levels
AtoHandJtoQ, i.e.,LETTERS[1:17][-9].- nitrogen
a factor specifying the amount of nitrogen sulfate (\(NH_4\)), with the four levels
0,1,2,4.- potash
a factor specifying the amount of potassium (K, ‘kalium’) sulfate, with the four levels
0,1,2,4.- yield
a numeric vector giving the yield of potatoes in ...
% << FIXME
Source
Bennett, J. H. (1972) Collected Papers of R. A. Fischer vol.~II, 1925-31; The University of Adelaide.
References
T.Eden and R. A. Fisher (1929) Studies in Crop Variation. VI. Experiments on the Response of the Potato to Potash and Nitrogen. J. Agricultural Science 19, 201–213. Accessible from Bennett (1972), see above.
Examples
data(potatoes)
## See the experimental design:
with(potatoes, {
cat("4 blocks of experiments;",
"each does every (nitrogen,potash) combination (aka 'treat'ment) once.",
'', sep="\n")
print(ftable(table(nitrogen, potash, treat)))
print(ftable(tt <- table(pos,potash,nitrogen)))
tt[cbind(pos,potash,nitrogen)] <- as.character(treat)
cat("The 4 blocks pos = 1, 2, 3, 4:\n")
ftable(tt)
})
#> 4 blocks of experiments;
#> each does every (nitrogen,potash) combination (aka 'treat'ment) once.
#>
#> treat A B C D E F G H J K L M N O P Q
#> nitrogen potash
#> 0 0 4 0 0 0 0 0 0 0 0 0 0 0 0 0 0 0
#> 1 0 4 0 0 0 0 0 0 0 0 0 0 0 0 0 0
#> 2 0 0 4 0 0 0 0 0 0 0 0 0 0 0 0 0
#> 4 0 0 0 4 0 0 0 0 0 0 0 0 0 0 0 0
#> 1 0 0 0 0 0 4 0 0 0 0 0 0 0 0 0 0 0
#> 1 0 0 0 0 0 4 0 0 0 0 0 0 0 0 0 0
#> 2 0 0 0 0 0 0 4 0 0 0 0 0 0 0 0 0
#> 4 0 0 0 0 0 0 0 4 0 0 0 0 0 0 0 0
#> 2 0 0 0 0 0 0 0 0 0 4 0 0 0 0 0 0 0
#> 1 0 0 0 0 0 0 0 0 0 4 0 0 0 0 0 0
#> 2 0 0 0 0 0 0 0 0 0 0 4 0 0 0 0 0
#> 4 0 0 0 0 0 0 0 0 0 0 0 4 0 0 0 0
#> 4 0 0 0 0 0 0 0 0 0 0 0 0 0 4 0 0 0
#> 1 0 0 0 0 0 0 0 0 0 0 0 0 0 4 0 0
#> 2 0 0 0 0 0 0 0 0 0 0 0 0 0 0 4 0
#> 4 0 0 0 0 0 0 0 0 0 0 0 0 0 0 0 4
#> nitrogen 0 1 2 4
#> pos potash
#> 1 0 1 1 1 1
#> 1 1 1 1 1
#> 2 1 1 1 1
#> 4 1 1 1 1
#> 2 0 1 1 1 1
#> 1 1 1 1 1
#> 2 1 1 1 1
#> 4 1 1 1 1
#> 3 0 1 1 1 1
#> 1 1 1 1 1
#> 2 1 1 1 1
#> 4 1 1 1 1
#> 4 0 1 1 1 1
#> 1 1 1 1 1
#> 2 1 1 1 1
#> 4 1 1 1 1
#> The 4 blocks pos = 1, 2, 3, 4:
#> nitrogen 0 1 2 4
#> pos potash
#> 1 0 A E J N
#> 1 B F K O
#> 2 C G L P
#> 4 D H M Q
#> 2 0 A E J N
#> 1 B F K O
#> 2 C G L P
#> 4 D H M Q
#> 3 0 A E J N
#> 1 B F K O
#> 2 C G L P
#> 4 D H M Q
#> 4 0 A E J N
#> 1 B F K O
#> 2 C G L P
#> 4 D H M Q
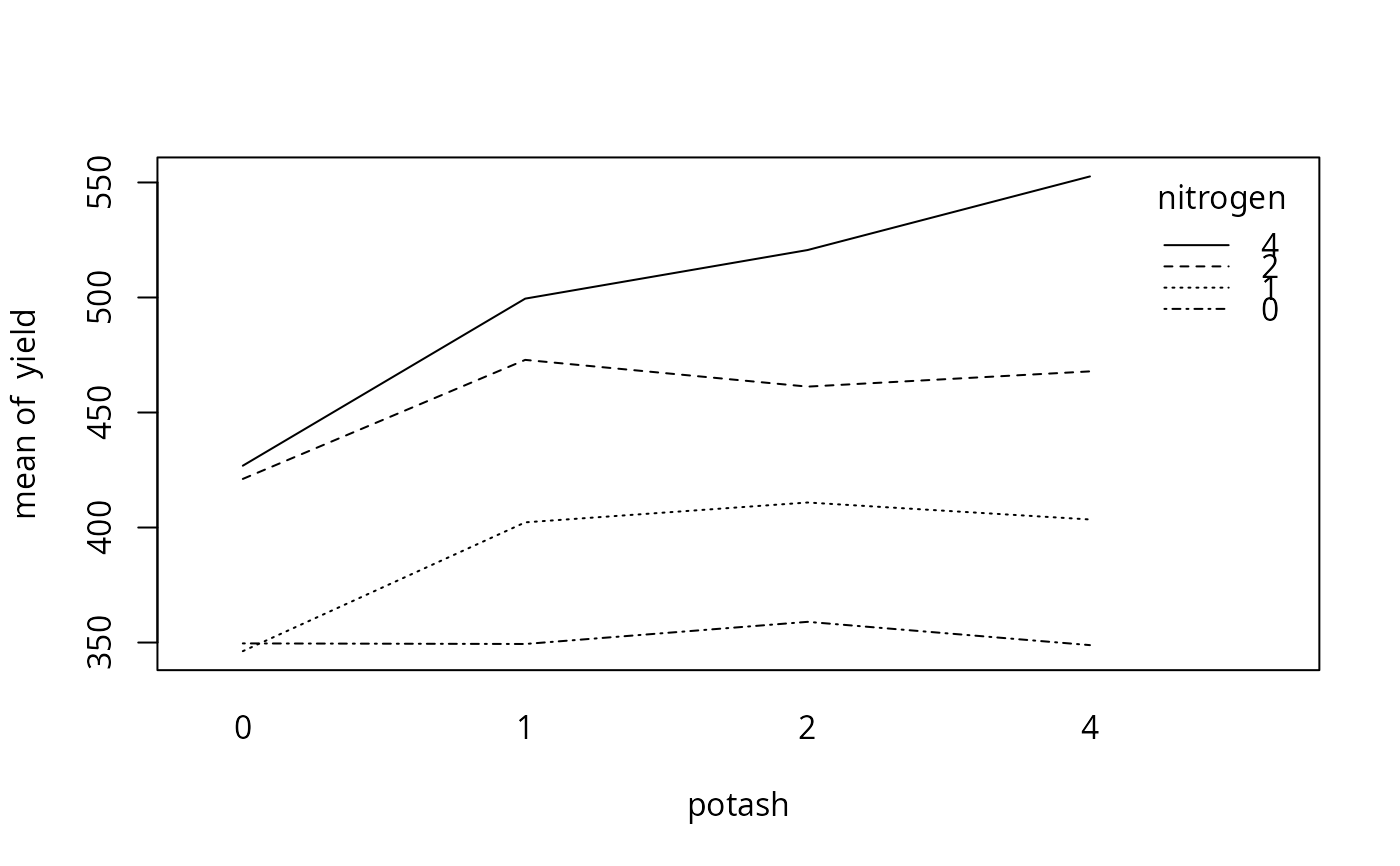
## First plot:
with(potatoes, interaction.plot(potash,nitrogen, response=yield))
 ## ANOVAs:
summary(aov(yield ~ nitrogen * potash + Error(pos), data = potatoes))
#>
#> Error: pos
#> Df Sum Sq Mean Sq F value Pr(>F)
#> Residuals 3 11303 3768
#>
#> Error: Within
#> Df Sum Sq Mean Sq F value Pr(>F)
#> nitrogen 3 209646 69882 32.30 2.7e-11 ***
#> potash 3 32926 10975 5.07 0.0041 **
#> nitrogen:potash 9 18925 2103 0.97 0.4756
#> Residuals 45 97361 2164
#> ---
#> Signif. codes: 0 ‘***’ 0.001 ‘**’ 0.01 ‘*’ 0.05 ‘.’ 0.1 ‘ ’ 1
# "==>" can use simply
summary(aov(yield ~ nitrogen + potash + pos, data = potatoes))
#> Df Sum Sq Mean Sq F value Pr(>F)
#> nitrogen 3 209646 69882 32.45 4e-12 ***
#> potash 3 32926 10975 5.10 0.0035 **
#> pos 3 11303 3768 1.75 0.1678
#> Residuals 54 116286 2153
#> ---
#> Signif. codes: 0 ‘***’ 0.001 ‘**’ 0.01 ‘*’ 0.05 ‘.’ 0.1 ‘ ’ 1
# and
summary(aov(yield ~ nitrogen + potash, data = potatoes))
#> Df Sum Sq Mean Sq F value Pr(>F)
#> nitrogen 3 209646 69882 31.2 4.5e-12 ***
#> potash 3 32926 10975 4.9 0.0042 **
#> Residuals 57 127589 2238
#> ---
#> Signif. codes: 0 ‘***’ 0.001 ‘**’ 0.01 ‘*’ 0.05 ‘.’ 0.1 ‘ ’ 1
## ANOVAs:
summary(aov(yield ~ nitrogen * potash + Error(pos), data = potatoes))
#>
#> Error: pos
#> Df Sum Sq Mean Sq F value Pr(>F)
#> Residuals 3 11303 3768
#>
#> Error: Within
#> Df Sum Sq Mean Sq F value Pr(>F)
#> nitrogen 3 209646 69882 32.30 2.7e-11 ***
#> potash 3 32926 10975 5.07 0.0041 **
#> nitrogen:potash 9 18925 2103 0.97 0.4756
#> Residuals 45 97361 2164
#> ---
#> Signif. codes: 0 ‘***’ 0.001 ‘**’ 0.01 ‘*’ 0.05 ‘.’ 0.1 ‘ ’ 1
# "==>" can use simply
summary(aov(yield ~ nitrogen + potash + pos, data = potatoes))
#> Df Sum Sq Mean Sq F value Pr(>F)
#> nitrogen 3 209646 69882 32.45 4e-12 ***
#> potash 3 32926 10975 5.10 0.0035 **
#> pos 3 11303 3768 1.75 0.1678
#> Residuals 54 116286 2153
#> ---
#> Signif. codes: 0 ‘***’ 0.001 ‘**’ 0.01 ‘*’ 0.05 ‘.’ 0.1 ‘ ’ 1
# and
summary(aov(yield ~ nitrogen + potash, data = potatoes))
#> Df Sum Sq Mean Sq F value Pr(>F)
#> nitrogen 3 209646 69882 31.2 4.5e-12 ***
#> potash 3 32926 10975 4.9 0.0042 **
#> Residuals 57 127589 2238
#> ---
#> Signif. codes: 0 ‘***’ 0.001 ‘**’ 0.01 ‘*’ 0.05 ‘.’ 0.1 ‘ ’ 1