Actually computes \(L = \sqrt{K/\pi}\).
Arguments
- pp
a list such as a pp object, including components x and y
- fs
full scale of the plot
- k
number of regularly spaced distances in (0, fs)
Value
A list with components
- x
vector of distances
- y
vector of L-fn values
- k
number of distances returned – may be less than k if fs is too large
- dmin
minimum distance between pair of points
- lm
maximum deviation from L(t) = t
Details
relies on the domain D having been set by ppinit or ppregion.
References
Ripley, B. D. (1981) Spatial Statistics. Wiley.
Venables, W. N. and Ripley, B. D. (2002)
Modern Applied Statistics with S. Fourth edition. Springer.
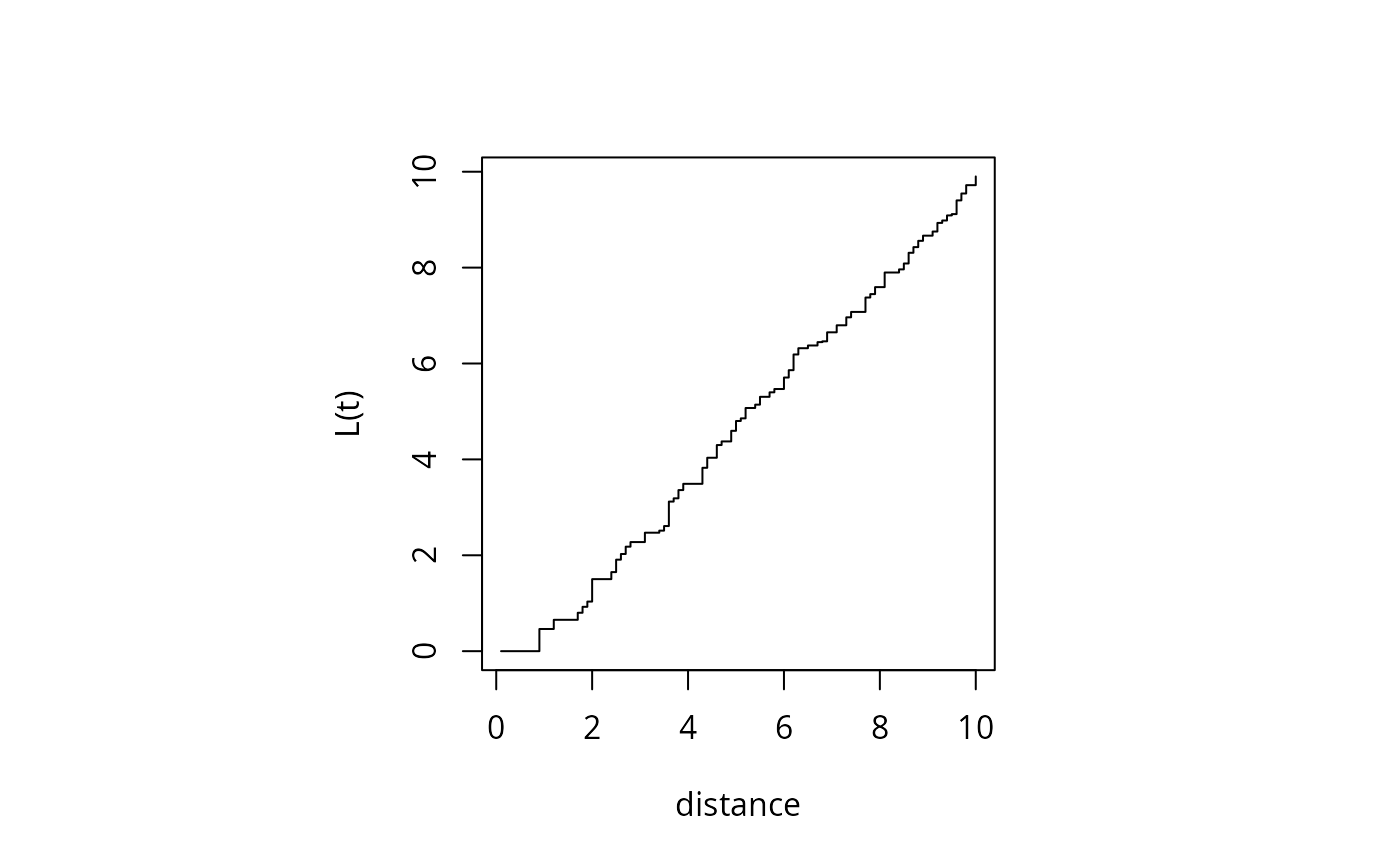
Examples
towns <- ppinit("towns.dat")
par(pty="s")
plot(Kfn(towns, 10), type="s", xlab="distance", ylab="L(t)")