Regression diagnostics for trend surfaces
trls.influence.RdThis function provides the basic quantities which are used in
forming a variety of diagnostics for checking the quality of
regression fits for trend surfaces calculated by surf.ls.
Usage
trls.influence(object)
# S3 method for class 'trls'
plot(x, border = "red", col = NA, pch = 4, cex = 0.6,
add = FALSE, div = 8, ...)Value
trls.influence returns a list with components:
- r
raw residuals as given by
residuals.trls- hii
diagonal elements of the Hat matrix
- stresid
standardised residuals
- Di
Cook's statistic
References
Unwin, D. J., Wrigley, N. (1987) Towards a general-theory of control point distribution effects in trend surface models. Computers and Geosciences, 13, 351–355.
Venables, W. N. and Ripley, B. D. (2002) Modern Applied Statistics with S. Fourth edition. Springer.
Examples
library(MASS) # for eqscplot
data(topo, package = "MASS")
topo2 <- surf.ls(2, topo)
infl.topo2 <- trls.influence(topo2)
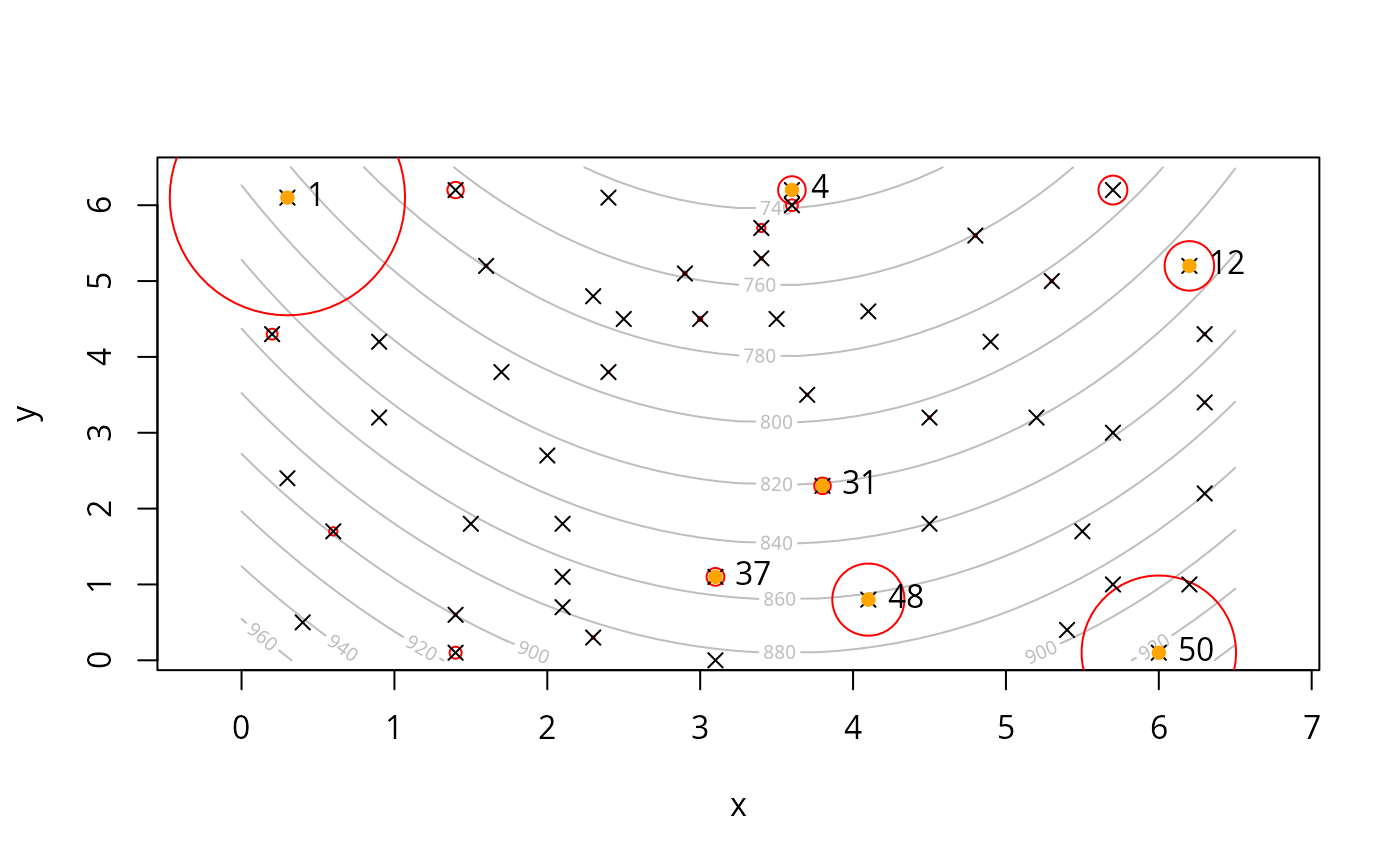
(cand <- as.data.frame(infl.topo2)[abs(infl.topo2$stresid) > 1.5, ])
#> r hii stresid Di
#> 1 61.21889 0.35476783 2.585852 0.61275133
#> 4 -45.58507 0.13493260 -1.662930 0.07188916
#> 12 44.71663 0.21022336 1.707234 0.12930392
#> 31 52.05575 0.07154233 1.833006 0.04314966
#> 37 54.75944 0.06974770 1.926349 0.04637112
#> 48 97.75499 0.08574061 3.468809 0.18807312
#> 50 -63.25149 0.27530059 -2.520972 0.40237779
cand.xy <- topo[as.integer(rownames(cand)), c("x", "y")]
trsurf <- trmat(topo2, 0, 6.5, 0, 6.5, 50)
eqscplot(trsurf, type = "n")
contour(trsurf, add = TRUE, col = "grey")
plot(topo2, add = TRUE, div = 3)
points(cand.xy, pch = 16, col = "orange")
text(cand.xy, labels = rownames(cand.xy), pos = 4, offset = 0.5)