Displays a graph of the scaled Schoenfeld residuals, along with a smooth curve using ggplot2. Wrapper around plot.cox.zph.
ggcoxzph(
  fit,
  resid = TRUE,
  se = TRUE,
  df = 4,
  nsmo = 40,
  var,
  point.col = "red",
  point.size = 1,
  point.shape = 19,
  point.alpha = 1,
  caption = NULL,
  ggtheme = theme_survminer(),
  ...
)

# S3 method for class 'ggcoxzph'
print(x, ..., newpage = TRUE)
Arguments
- fit
an object of class cox.zph.
- resid
a logical value, if TRUE the residuals are included on the plot, as well as the smooth fit.
- se
a logical value, if TRUE, confidence bands at two standard errors will be added.
- df
the degrees of freedom for the fitted natural spline, df=2 leads to a linear fit.
- nsmo
number of points used to plot the fitted spline.
- var
the set of variables for which plots are desired. By default, plots are produced in turn for each variable of a model.
- point.col, point.size, point.shape, point.alpha
color, size, shape and visibility to be used for points.
- caption
the caption of the final grob (
bottomin arrangeGrob)- ggtheme
function, ggplot2 theme name. Allowed values include ggplot2 official themes: see
theme.- ...
further arguments passed to either the print() function or to the
ggparfunction for customizing the plot (see Details section).- x
an object of class ggcoxzph
- newpage
open a new page. See
grid.arrange.
Value
Returns an object of class ggcoxzph which is a list of ggplots.
Details
Customizing the plots: The plot can be easily customized using additional arguments to be passed to the function ggpar(). Read ?ggpubr::ggpar. These arguments include font.main,font.submain,font.caption,font.x,font.y,font.tickslab,font.legend: a vector of length 3 indicating respectively the size (e.g.: 14), the style (e.g.: "plain", "bold", "italic", "bold.italic") and the color (e.g.: "red") of main title, subtitle, caption, xlab and ylab and axis tick labels, respectively. For example font.x = c(14, "bold", "red"). Use font.x = 14, to change only font size; or use font.x = "bold", to change only font face.
Functions
ggcoxzph(): Graphical Test of Proportional Hazards using ggplot2.
Examples
library(survival)
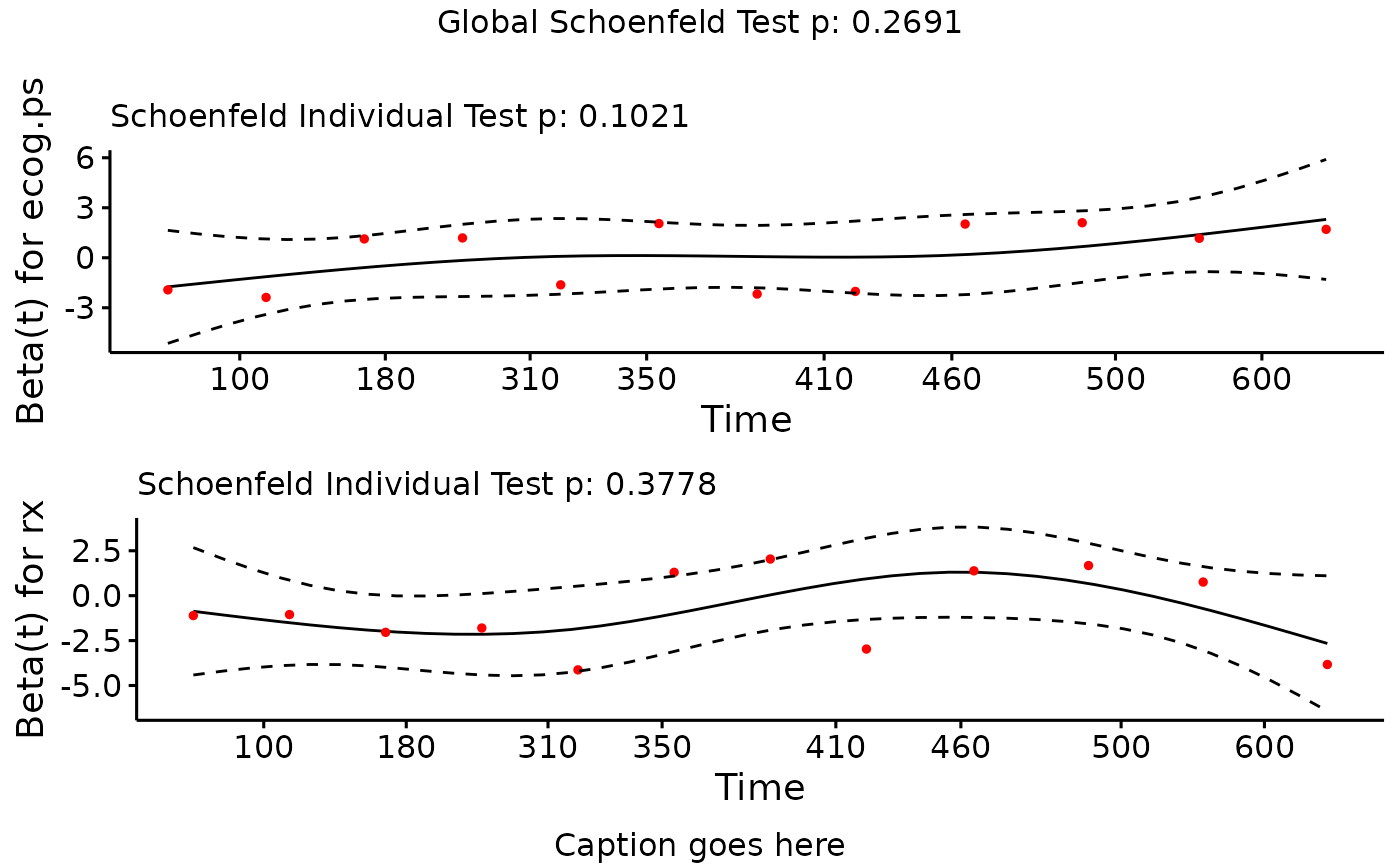
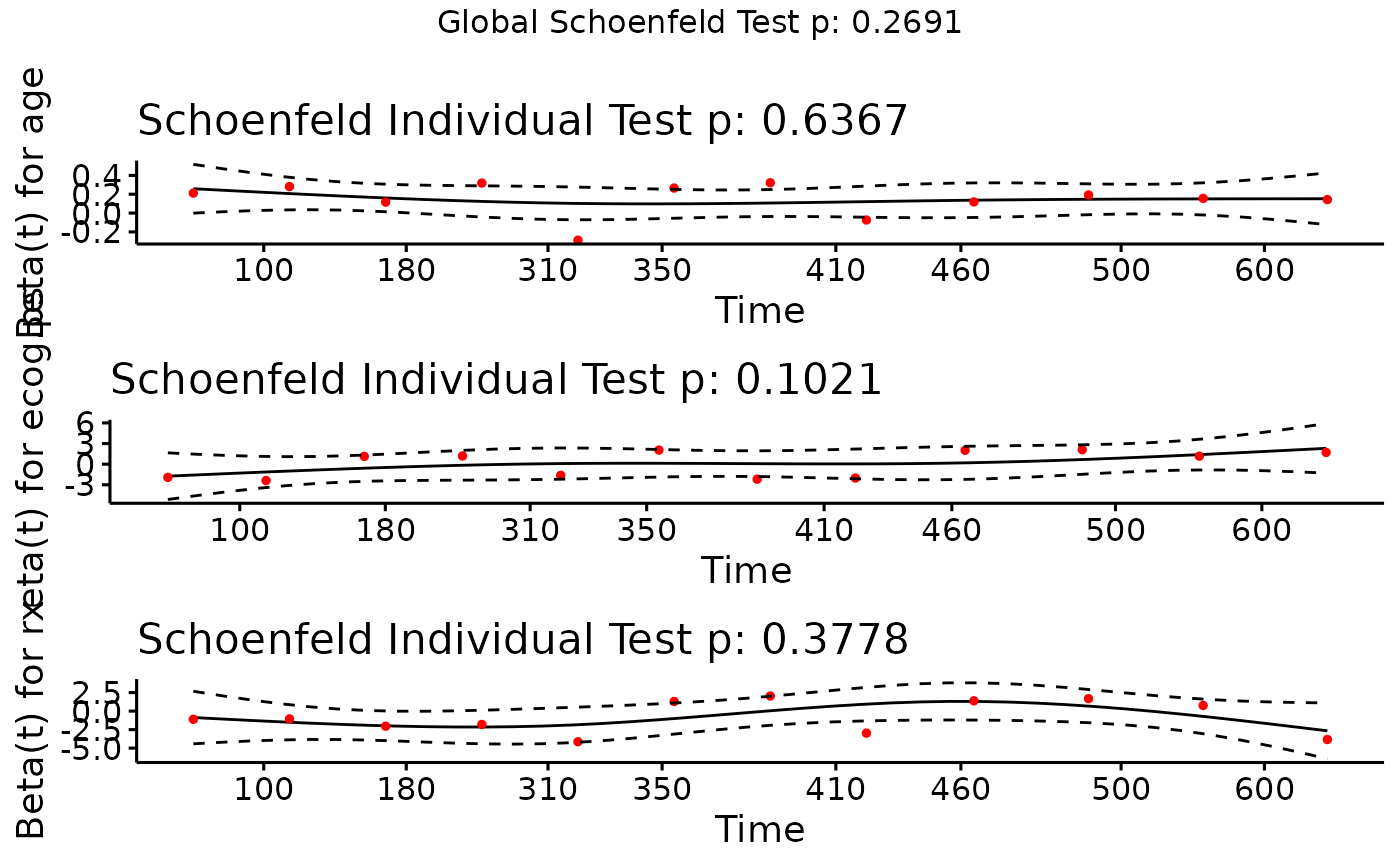
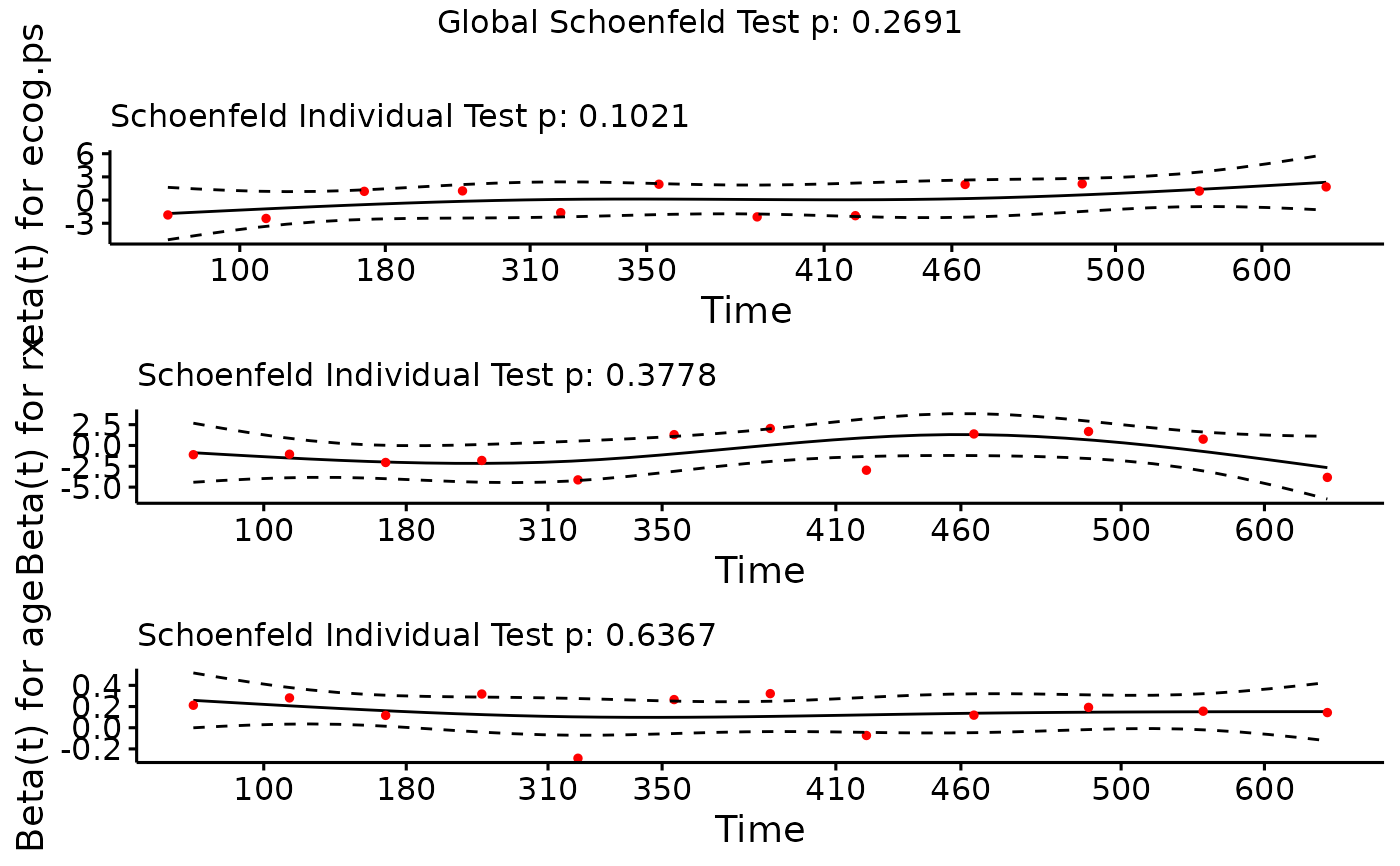
fit <- coxph(Surv(futime, fustat) ~ age + ecog.ps + rx, data=ovarian)
cox.zph.fit <- cox.zph(fit)
# plot all variables
ggcoxzph(cox.zph.fit)
 # plot all variables in specified order
ggcoxzph(cox.zph.fit, var = c("ecog.ps", "rx", "age"), font.main = 12)
# plot all variables in specified order
ggcoxzph(cox.zph.fit, var = c("ecog.ps", "rx", "age"), font.main = 12)
 # plot specified variables in specified order
ggcoxzph(cox.zph.fit, var = c("ecog.ps", "rx"), font.main = 12, caption = "Caption goes here")
# plot specified variables in specified order
ggcoxzph(cox.zph.fit, var = c("ecog.ps", "rx"), font.main = 12, caption = "Caption goes here")