Drawing Forest Plot for Cox proportional hazards model. In two panels the model structure is presented.
ggforest(
  model,
  data = NULL,
  main = "Hazard ratio",
  cpositions = c(0.02, 0.22, 0.4),
  fontsize = 0.7,
  refLabel = "reference",
  noDigits = 2
)
Arguments
- model
an object of class coxph.
- data
a dataset used to fit survival curves. If not supplied then data will be extracted from 'fit' object.
- main
title of the plot.
- cpositions
relative positions of first three columns in the OX scale.
- fontsize
relative size of annotations in the plot. Default value: 0.7.
- refLabel
label for reference levels of factor variables.
- noDigits
number of digits for estimates and p-values in the plot.
Value
returns a ggplot2 object (invisibly)
Examples
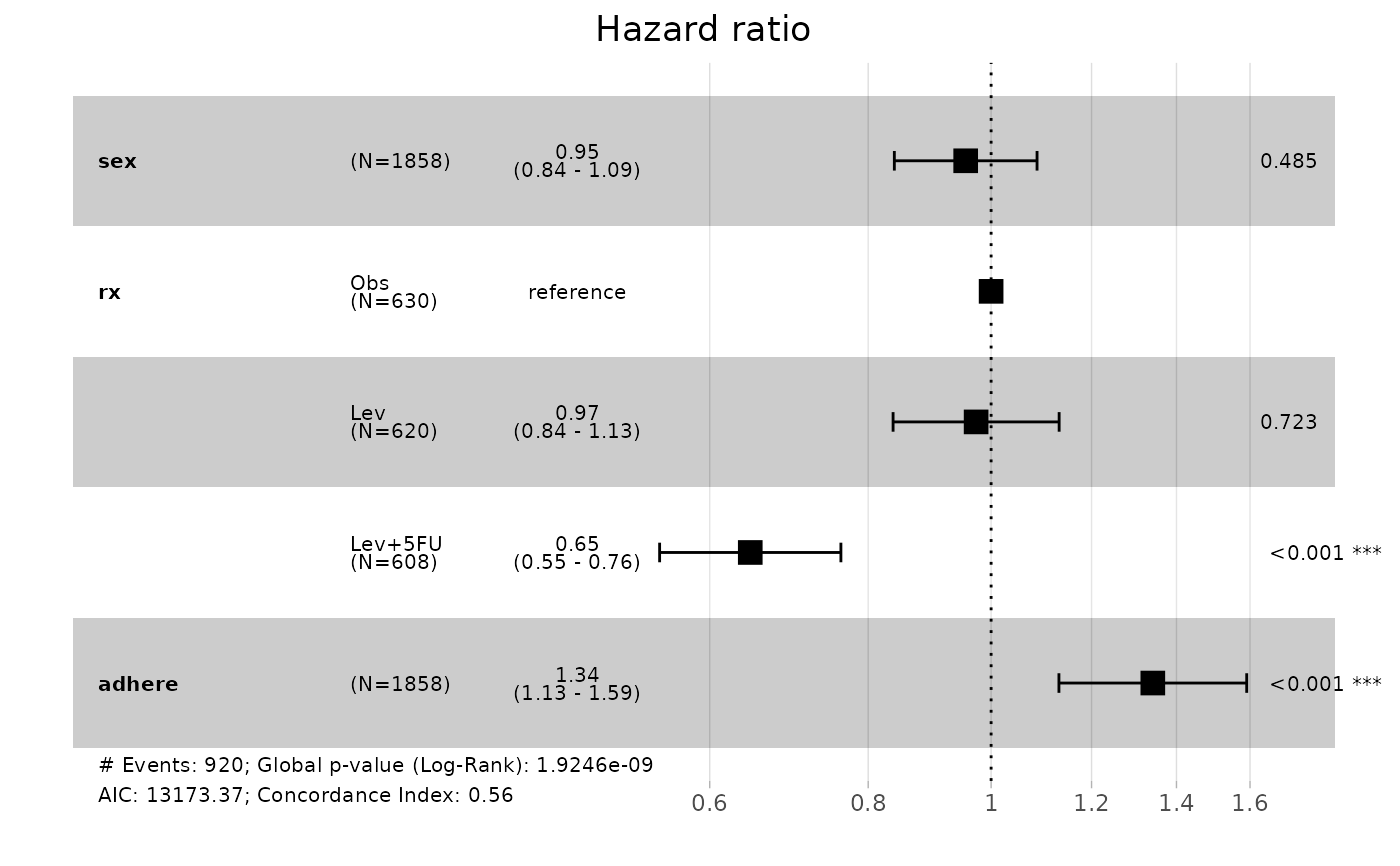
require("survival")
model <- coxph( Surv(time, status) ~ sex + rx + adhere,
data = colon )
ggforest(model)
#> Warning: The `data` argument is not provided. Data will be extracted from model fit.
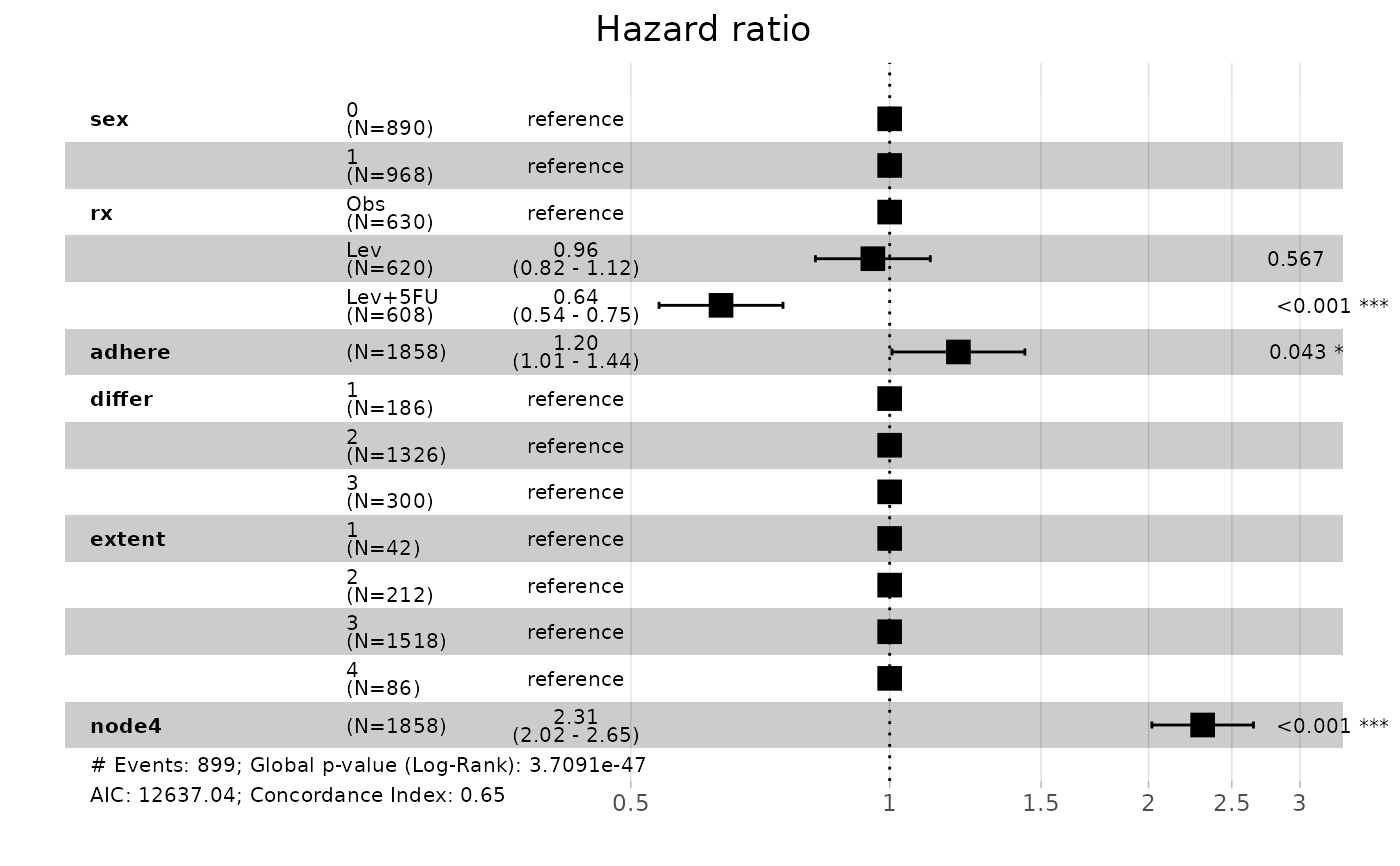
 colon <- within(colon, {
sex <- factor(sex, labels = c("female", "male"))
differ <- factor(differ, labels = c("well", "moderate", "poor"))
extent <- factor(extent, labels = c("submuc.", "muscle", "serosa", "contig."))
})
bigmodel <-
coxph(Surv(time, status) ~ sex + rx + adhere + differ + extent + node4,
data = colon )
ggforest(bigmodel)
#> Warning: The `data` argument is not provided. Data will be extracted from model fit.
colon <- within(colon, {
sex <- factor(sex, labels = c("female", "male"))
differ <- factor(differ, labels = c("well", "moderate", "poor"))
extent <- factor(extent, labels = c("submuc.", "muscle", "serosa", "contig."))
})
bigmodel <-
coxph(Surv(time, status) ~ sex + rx + adhere + differ + extent + node4,
data = colon )
ggforest(bigmodel)
#> Warning: The `data` argument is not provided. Data will be extracted from model fit.