Take a list of survfit objects and produce a list of
ggsurvplots.
ggsurvplot_list(
  fit,
  data,
  title = NULL,
  legend.labs = NULL,
  legend.title = "Strata",
  ...
)
Arguments
- fit
a list of survfit objects.
- data
data used to fit survival curves. Can be also a list of same length than
fit.- title
title of the plot. Can be a character vector or a list of titles of same length than
fit. Iftitleis not specified andfitis a named list, then the names of fit list are used as title.- legend.labs
character vector specifying legend labels. Used to replace the names of the strata from the fit. Should be given in the same order as those strata. Can be a list when
fitis a list.- legend.title
legend title for each plot. Can be a character vector or a list of titles of same length than fit.
- ...
other arguments passed to the core function
ggsurvplot
Value
Returns a list of ggsurvplots.
See also
Examples
library(survival)
# Create a list of formulas
#:::::::::::::::::::::::::::::::::::::::::::::::::::::::
data(colon)
#> Warning: data set ‘colon’ not found
f1 <- survfit(Surv(time, status) ~ adhere, data = colon)
f2 <- survfit(Surv(time, status) ~ rx, data = colon)
fits <- list(sex = f1, rx = f2)
# Visualize
#:::::::::::::::::::::::::::::::::::::::::::::::::::::::
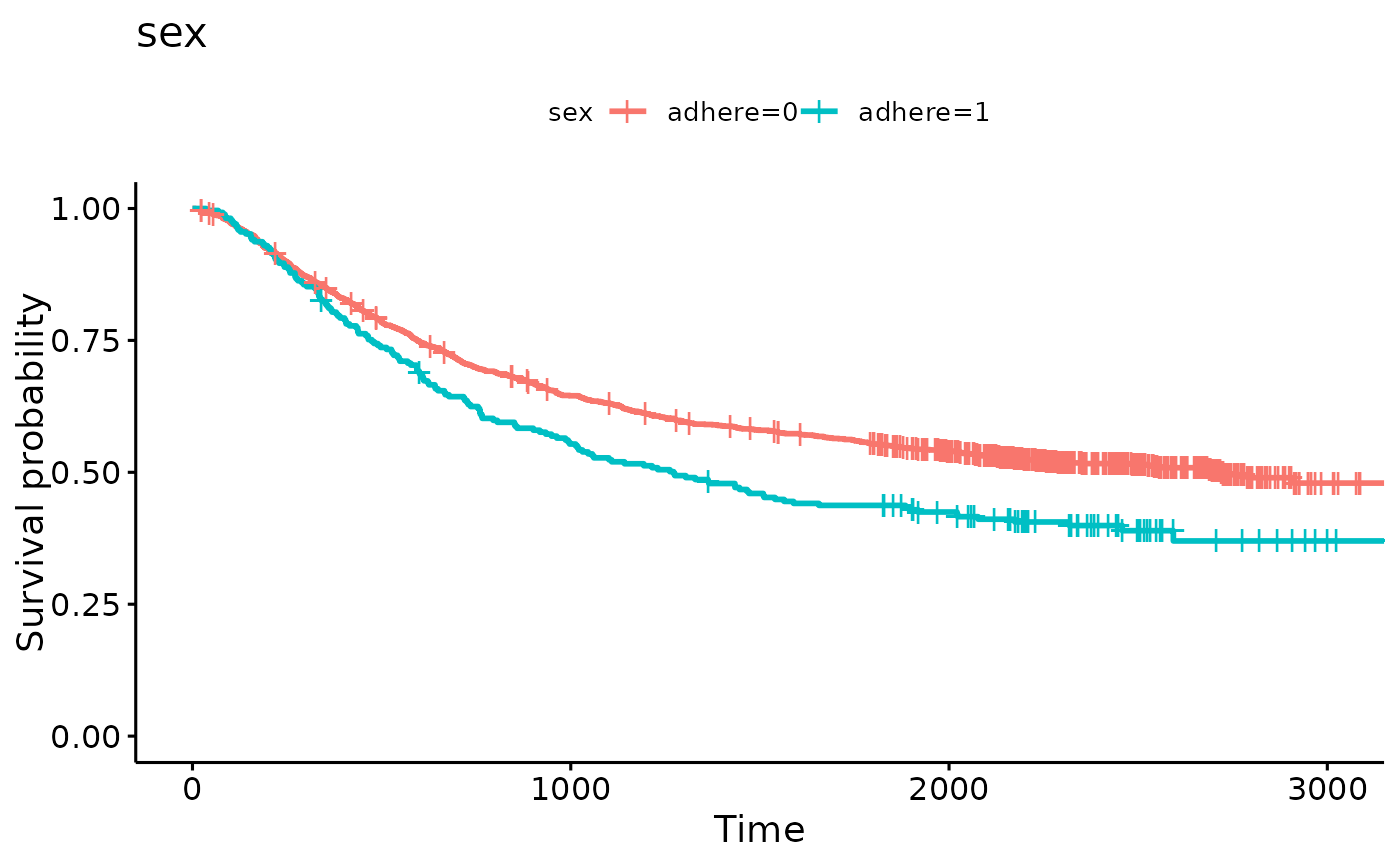
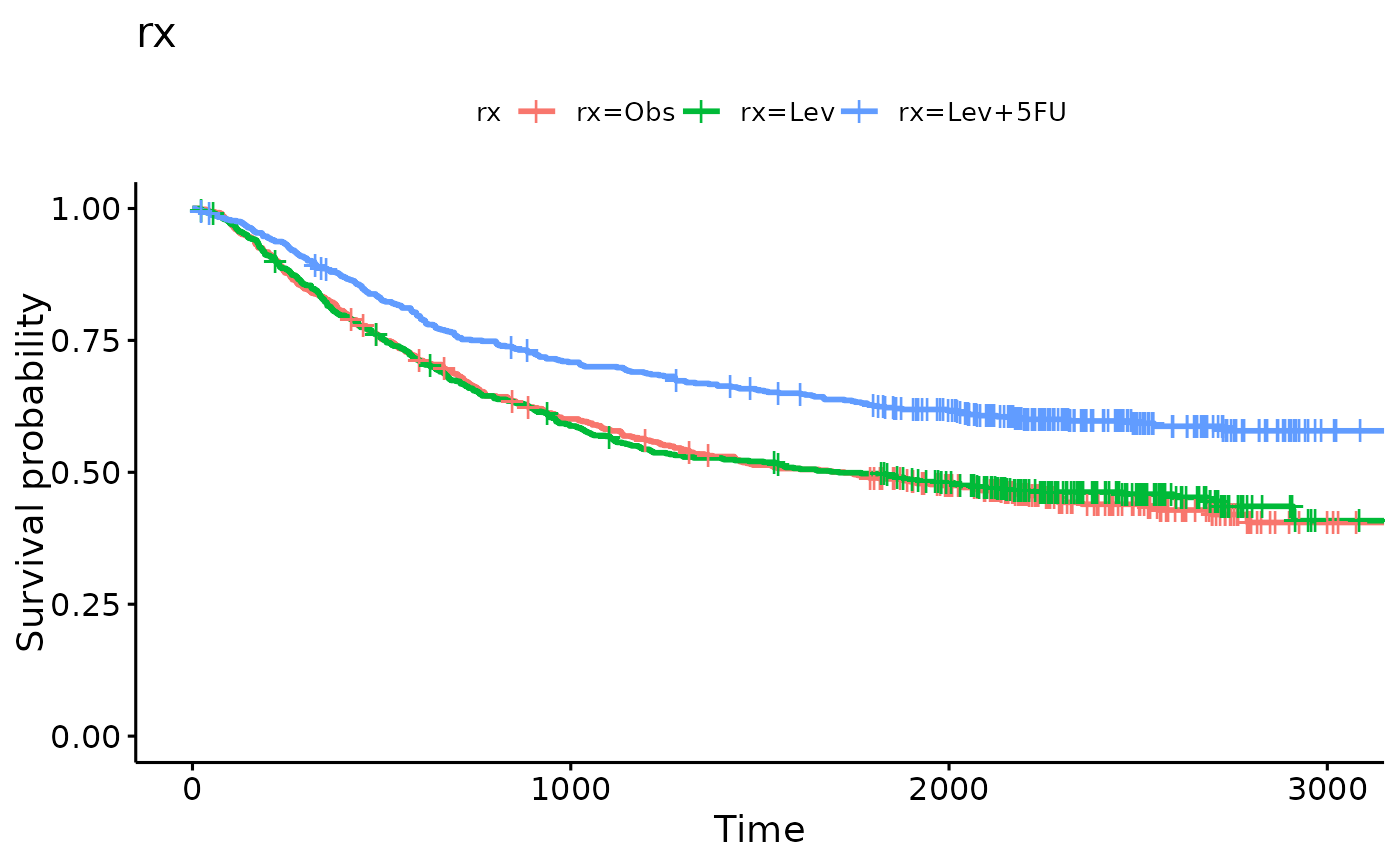
legend.title <- list("sex", "rx")
ggsurvplot_list(fits, colon, legend.title = legend.title)
#> $sex
 #>
#> $rx
#>
#> $rx
 #>
#> attr(,"class")
#> [1] "list" "ggsurvplot_list"
#>
#> attr(,"class")
#> [1] "list" "ggsurvplot_list"