Arranging multiple ggsurvplots on the same page.
arrange_ggsurvplots(
  x,
  print = TRUE,
  title = NA,
  ncol = 2,
  nrow = 1,
  surv.plot.height = NULL,
  risk.table.height = NULL,
  ncensor.plot.height = NULL,
  ...
)
Arguments
- x
a list of ggsurvplots.
logical value. If TRUE, the arranged plots are displayed.
- title
character vector specifying page title. Default is NA.
- ncol, nrow
the number of columns and rows, respectively.
- surv.plot.height
the height of the survival plot on the grid. Default is 0.75. Ignored when risk.table = FALSE.
1-risk.table.height - ncensor.plot.heightwhenrisk.table = TRUEandncensor.plot = TRUE- risk.table.height
the height of the risk table on the grid. Increase the value when you have many strata. Default is 0.25. Ignored when risk.table = FALSE.
- ncensor.plot.height
The height of the censor plot. Used when
ncensor.plot = TRUE.- ...
not used
Value
returns an invisible object of class arrangelist (see marrangeGrob), which can be saved into a pdf file using the function ggsave.
Examples
# Fit survival curves
require("survival")
fit<- survfit(Surv(time, status) ~ sex, data = lung)
# List of ggsurvplots
require("survminer")
splots <- list()
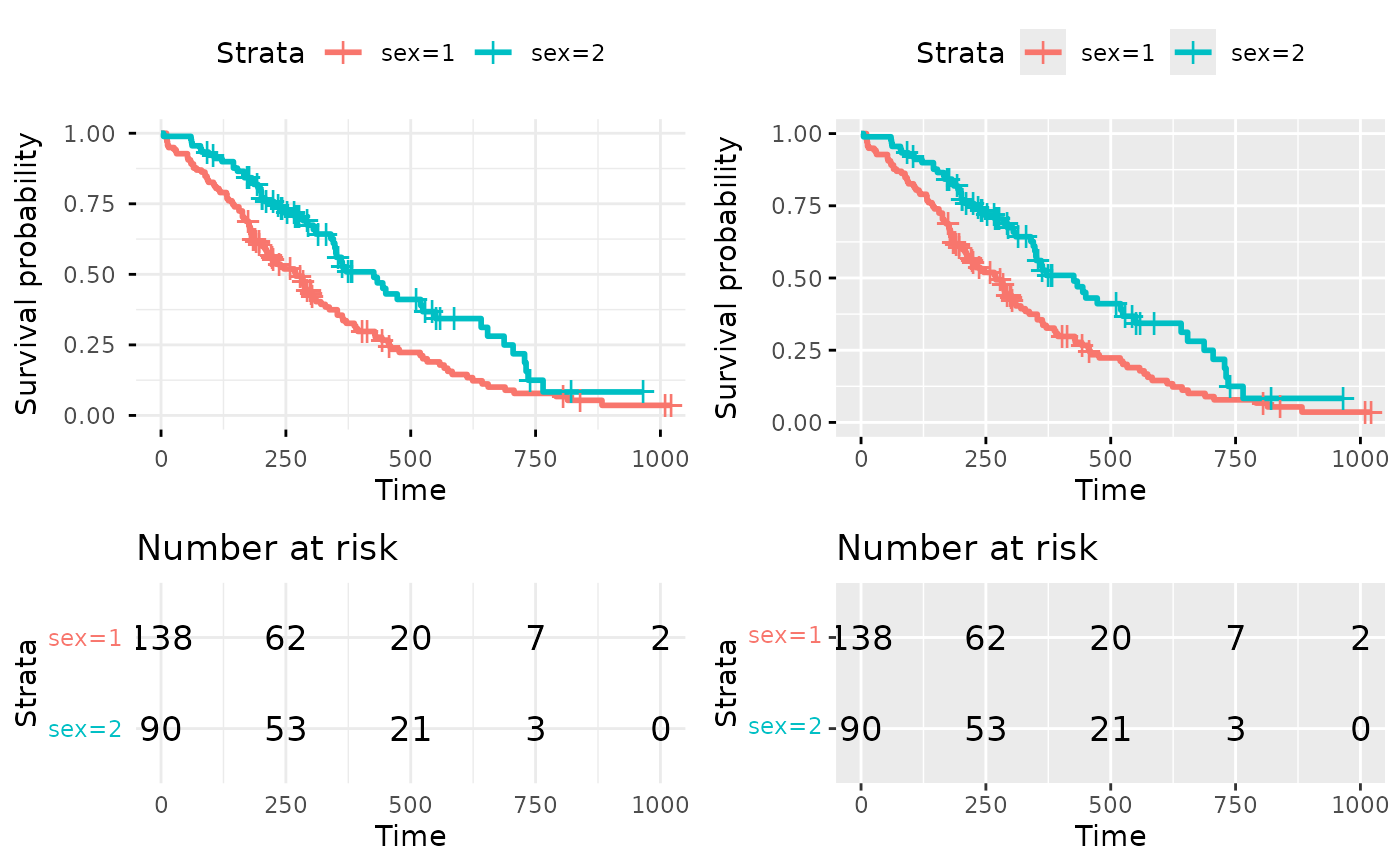
splots[[1]] <- ggsurvplot(fit, data = lung, risk.table = TRUE, ggtheme = theme_minimal())
splots[[2]] <- ggsurvplot(fit, data = lung, risk.table = TRUE, ggtheme = theme_grey())
# Arrange multiple ggsurvplots and print the output
arrange_ggsurvplots(splots, print = TRUE,
ncol = 2, nrow = 1, risk.table.height = 0.4)
#> Ignoring unknown labels:
#> • colour : "Strata"
#> Ignoring unknown labels:
#> • colour : "Strata"
 if (FALSE) { # \dontrun{
# Arrange and save into pdf file
res <- arrange_ggsurvplots(splots, print = FALSE)
ggsave("myfile.pdf", res)
} # }
if (FALSE) { # \dontrun{
# Arrange and save into pdf file
res <- arrange_ggsurvplots(splots, print = FALSE)
ggsave("myfile.pdf", res)
} # }