![[Stable]](figures/lifecycle-stable.svg)
Convenient function for calculating the median confidence interval. It can be used as a ggplot helper
function for plotting.
stat_median_ci(x, conf_level = 0.95, na.rm = TRUE, gg_helper = TRUE)Arguments
Value
A named vector of values median_ci_lwr and median_ci_upr.
Details
This function was adapted from DescTools/versions/0.99.35/source
Examples
stat_median_ci(sample(10), gg_helper = FALSE)
#> median_ci_lwr median_ci_upr
#> 2 9
#> attr(,"conf_level")
#> [1] 0.9785156
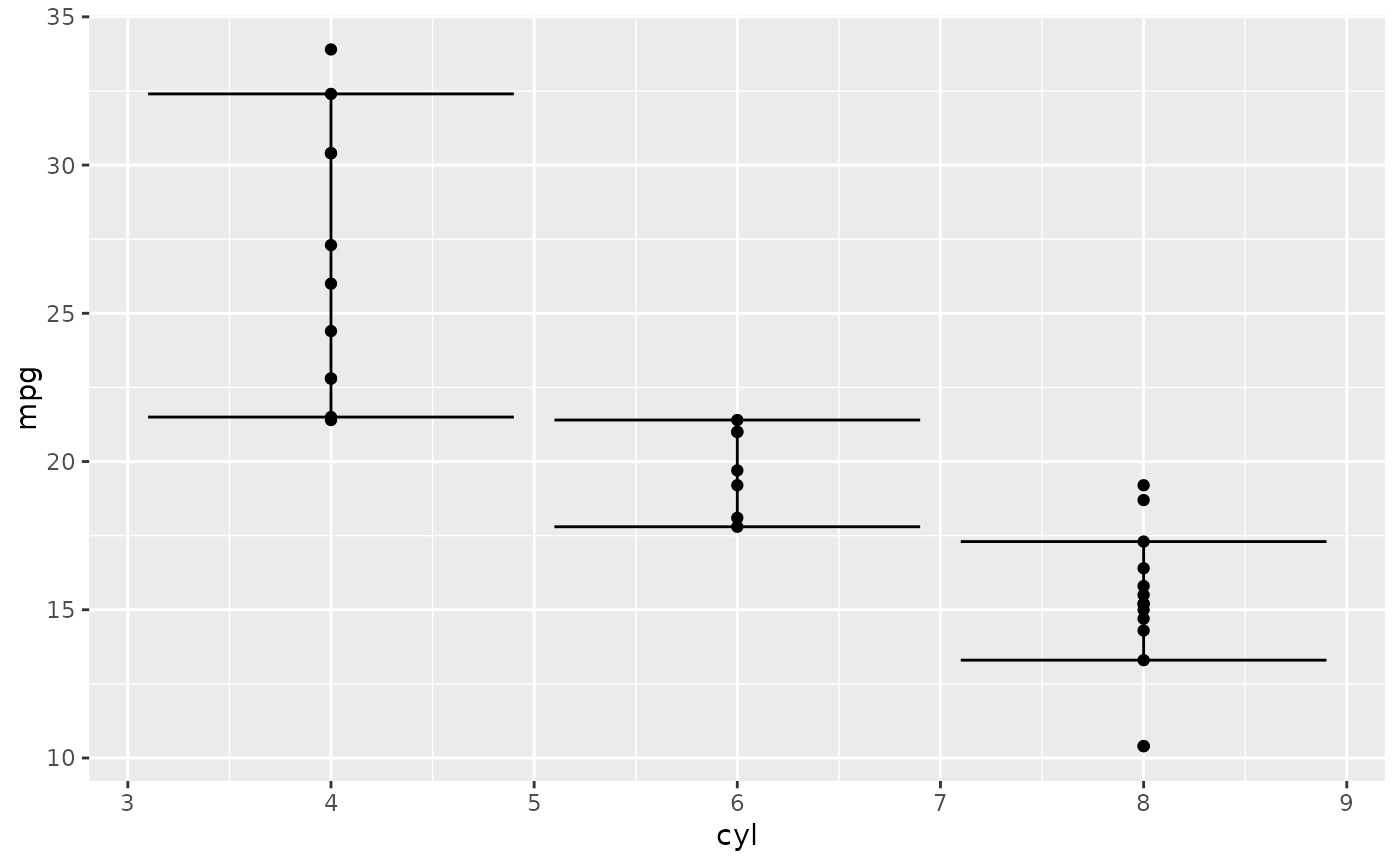
p <- ggplot2::ggplot(mtcars, ggplot2::aes(cyl, mpg)) +
ggplot2::geom_point()
p + ggplot2::stat_summary(
fun.data = stat_median_ci,
geom = "errorbar"
)