One-dimensional marginal CDF function for a Truncated Multivariate Normal and Student t distribution
ptmvnorm.marginal.RdThis function computes the one-dimensional marginal probability
function from a Truncated Multivariate Normal and Student t density function
using integration in pmvnorm() and pmvt().
ptmvnorm.marginal(xn,
    n = 1,
    mean = rep(0, nrow(sigma)),
    sigma = diag(length(mean)),
    lower = rep(-Inf, length = length(mean)),
    upper = rep(Inf, length = length(mean)))
ptmvt.marginal(xn,
    n = 1,
    mean = rep(0, nrow(sigma)),
    sigma = diag(length(mean)),
    df = 1,
    lower = rep(-Inf, length = length(mean)),
    upper = rep(Inf, length = length(mean)))
Arguments
- xn
Vector of quantiles to calculate the marginal probability for.
- n
Index position (1..k) within the random vector xn to calculate the one-dimensional marginal probability for.
- mean
the mean vector of length k.
- sigma
the covariance matrix of dimension k. Either
corrorsigmacan be specified. Ifsigmais given, the problem is standardized. If neithercorrnorsigmais given, the identity matrix is used forsigma.- df
degrees of freedom parameter
- lower
Vector of lower truncation points, default is
rep(-Inf, length = length(mean)).- upper
Vector of upper truncation points, default is
rep( Inf, length = length(mean)).
Details
The one-dimensional marginal probability for index i is
\(F_i(x_i) = P(X_i \le x_i)\)
$$F_i(x_i) = \int_{a_1}^{b_1} \ldots \int_{a_{i-1}}^{b_{i-1}} \int_{a_{i}}^{x_i} \int_{a_{i+1}}^{b_{i+1}} \ldots \int_{a_k}^{b_k} f(x) dx
= \alpha^{-1} \Phi_k(a, u, \mu, \Sigma)$$
where \(u = (b_1,\ldots,b_{i-1},x_i,b_{i+1},\ldots,b_k)'\)
is the upper integration bound and \(\Phi_k\)
is the k-dimensional normal probability (i.e. functions pmvnorm() and pmvt() in R package mvtnorm).
Value
Returns a vector of the same length as xn with probabilities.
Examples
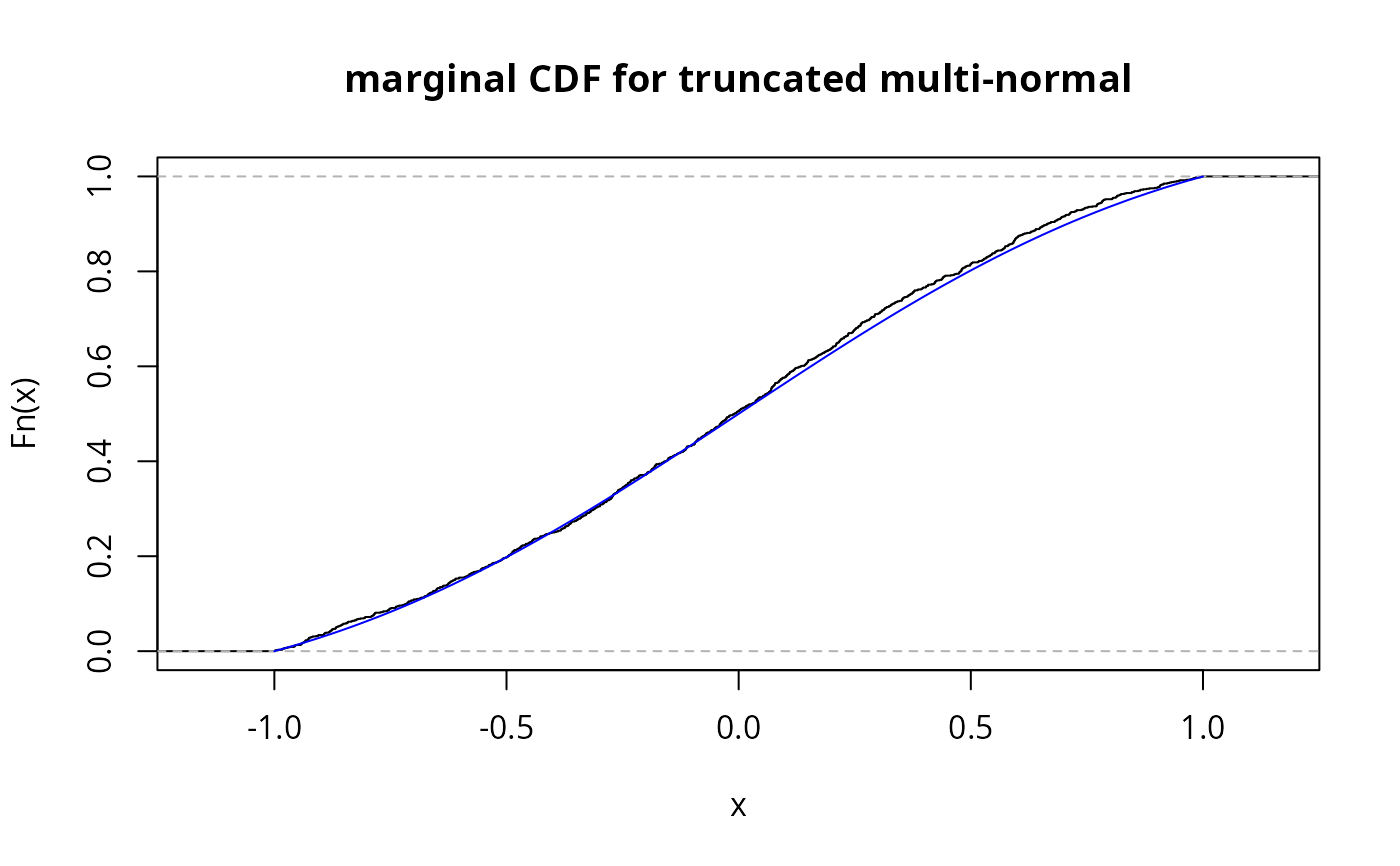
## Example 1: Truncated multi-normal
lower <- c(-1,-1,-1)
upper <- c(1,1,1)
mean <- c(0,0,0)
sigma <- matrix(c( 1, 0.8, 0.2,
0.8, 1, 0.1,
0.2, 0.1, 1), 3, 3)
X <- rtmvnorm(n=1000, mean=c(0,0,0), sigma=sigma, lower=lower, upper=upper)
x <- seq(-1, 1, by=0.01)
Fx <- ptmvnorm.marginal(xn=x, n=1, mean=c(0,0,0), sigma=sigma, lower=lower, upper=upper)
plot(ecdf(X[,1]), main="marginal CDF for truncated multi-normal")
lines(x, Fx, type="l", col="blue")
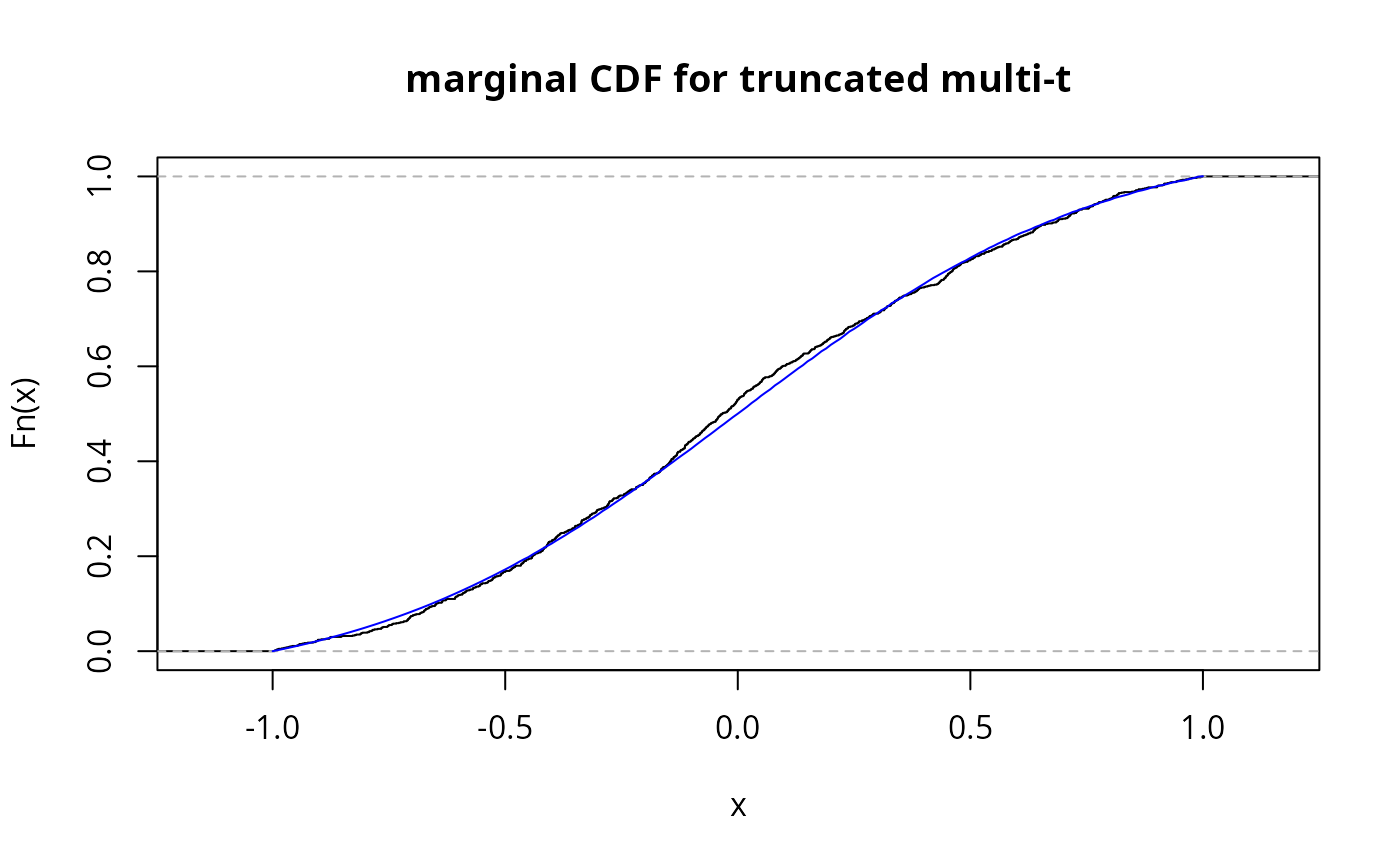
 ## Example 2: Truncated multi-t
X <- rtmvt(n=1000, mean=c(0,0,0), sigma=sigma, df=2, lower=lower, upper=upper)
x <- seq(-1, 1, by=0.01)
Fx <- ptmvt.marginal(xn=x, n=1, mean=c(0,0,0), sigma=sigma, lower=lower, upper=upper)
plot(ecdf(X[,1]), main="marginal CDF for truncated multi-t")
lines(x, Fx, type="l", col="blue")
## Example 2: Truncated multi-t
X <- rtmvt(n=1000, mean=c(0,0,0), sigma=sigma, df=2, lower=lower, upper=upper)
x <- seq(-1, 1, by=0.01)
Fx <- ptmvt.marginal(xn=x, n=1, mean=c(0,0,0), sigma=sigma, lower=lower, upper=upper)
plot(ecdf(X[,1]), main="marginal CDF for truncated multi-t")
lines(x, Fx, type="l", col="blue")