Methods for Irregular Time-Series Objects
irts-methods.RdMethods for irregular time-series objects.
# S3 method for class 'irts'
lines(x, type = "l", ...)
# S3 method for class 'irts'
plot(x, type = "l", plot.type = c("multiple", "single"),
     xlab = "Time", ylab = NULL, main = NULL, ylim = NULL,
     oma = c(6, 0, 5, 0), ...)
# S3 method for class 'irts'
points(x, type = "p", ...)
# S3 method for class 'irts'
print(x, format = "%Y-%m-%d %H:%M:%S", tz = "GMT",
      usetz = TRUE, format.value = NULL, ...)
# S3 method for class 'irts'
time(x, ...)
# S3 method for class 'irts'
value(x, ...)
# S3 method for class 'irts'
x[i, j, ...]
Arguments
- x
an object of class
"irts"; usually, a result of a call toirts.- type, plot.type, xlab, ylab, main, ylim, oma
graphical arguments, see
plot,points,lines,par, andplot.ts.- format, tz, usetz
formatting related arguments, see
format.POSIXct.- format.value
a string which specifies the formatting of the values when printing an irregular time-series object.
format.valueis passed unchanged as argumentformatto the functionformatC.- i, j
indices specifying the parts to extract from an irregular time-series object.
- ...
further arguments passed to or from other methods: for
linespassed tolines; forplotpassed toplot,plot.default, andmtext; forpointspassed topoints; forprintpassed toformatC; fortime,value, and[.irtsunused.
Details
plot is the method for plotting irregular time-series objects.
points and lines are the methods for drawing a sequence
of points as given by an irregular time-series object and joining the
corresponding points with line segments, respectively.
print is the method for printing irregular time-series objects.
time and value are the methods for extracting the
sequence of times and the sequence of values of an irregular
time-series object.
[.irts is the method for extracting parts of irregular
time-series objects.
Value
For time an object of class "POSIXct" representing the
sequence of times. For value a vector or matrix representing
the sequence of values.
For [.irts an object of class "irts" representing the
extracted part.
For plot, points, lines, and print the
irregular time-series object.
See also
Examples
n <- 10
t <- cumsum(rexp(n, rate = 0.1))
v <- rnorm(n)
x <- irts(t, v)
x
#> 1970-01-01 00:00:02 GMT -1.703
#> 1970-01-01 00:00:04 GMT -0.761
#> 1970-01-01 00:00:09 GMT -0.759
#> 1970-01-01 00:00:30 GMT 0.2926
#> 1970-01-01 00:00:43 GMT 0.3322
#> 1970-01-01 00:00:56 GMT -0.2319
#> 1970-01-01 00:01:01 GMT -0.8158
#> 1970-01-01 00:01:29 GMT 0.2161
#> 1970-01-01 00:01:40 GMT -1.139
#> 1970-01-01 00:01:56 GMT 0.1401
time(x)
#> [1] "1970-01-01 00:00:02 UTC" "1970-01-01 00:00:04 UTC"
#> [3] "1970-01-01 00:00:09 UTC" "1970-01-01 00:00:30 UTC"
#> [5] "1970-01-01 00:00:43 UTC" "1970-01-01 00:00:56 UTC"
#> [7] "1970-01-01 00:01:01 UTC" "1970-01-01 00:01:29 UTC"
#> [9] "1970-01-01 00:01:40 UTC" "1970-01-01 00:01:56 UTC"
value(x)
#> [1] -1.7031401 -0.7610384 -0.7590254 0.2926086 0.3322364 -0.2319348
#> [7] -0.8158072 0.2160748 -1.1388658 0.1401050
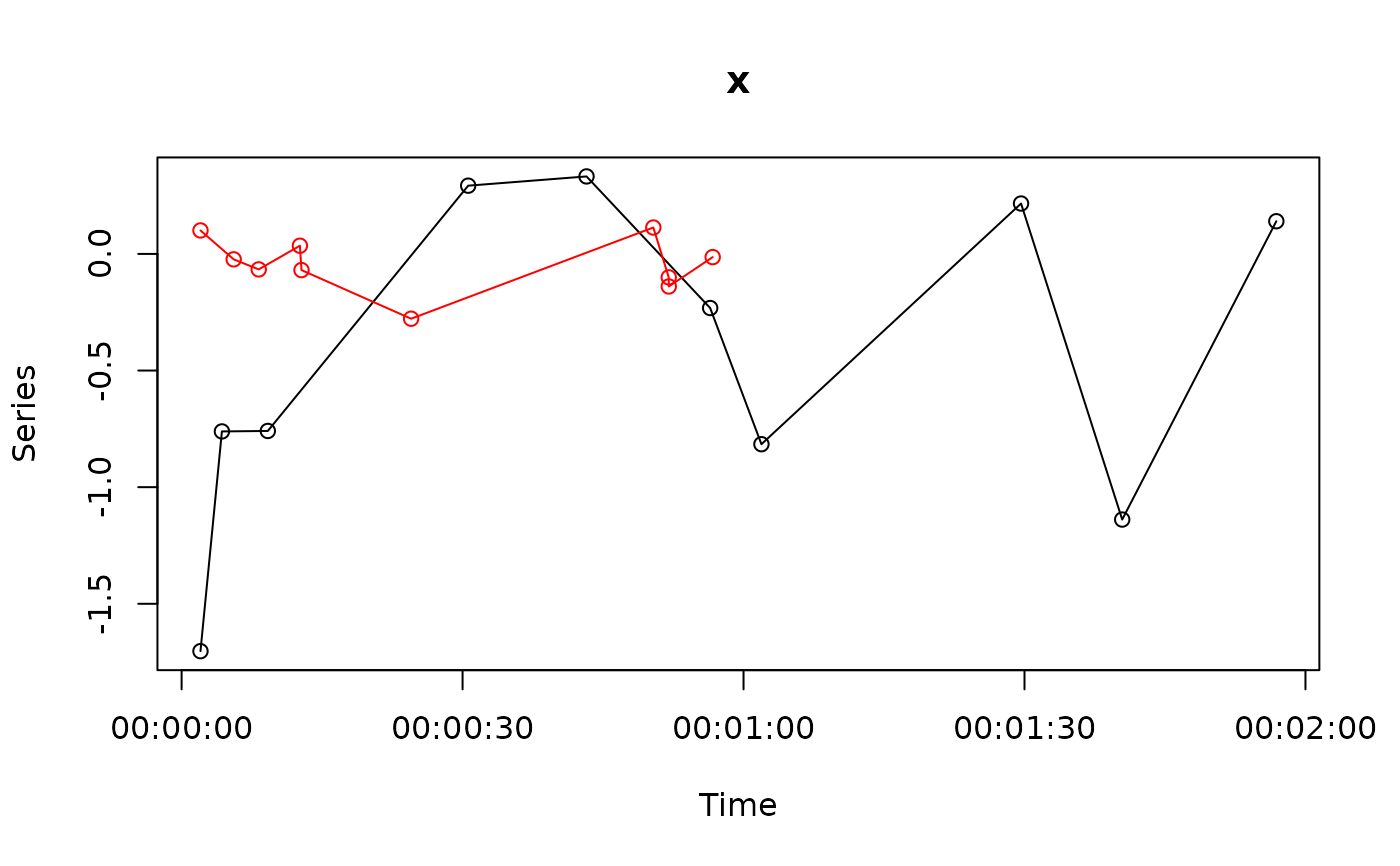
plot(x)
points(x)
t <- cumsum(c(t[1], rexp(n-1, rate = 0.2)))
v <- rnorm(n, sd = 0.1)
x <- irts(t, v)
lines(x, col = "red")
points(x, col = "red")
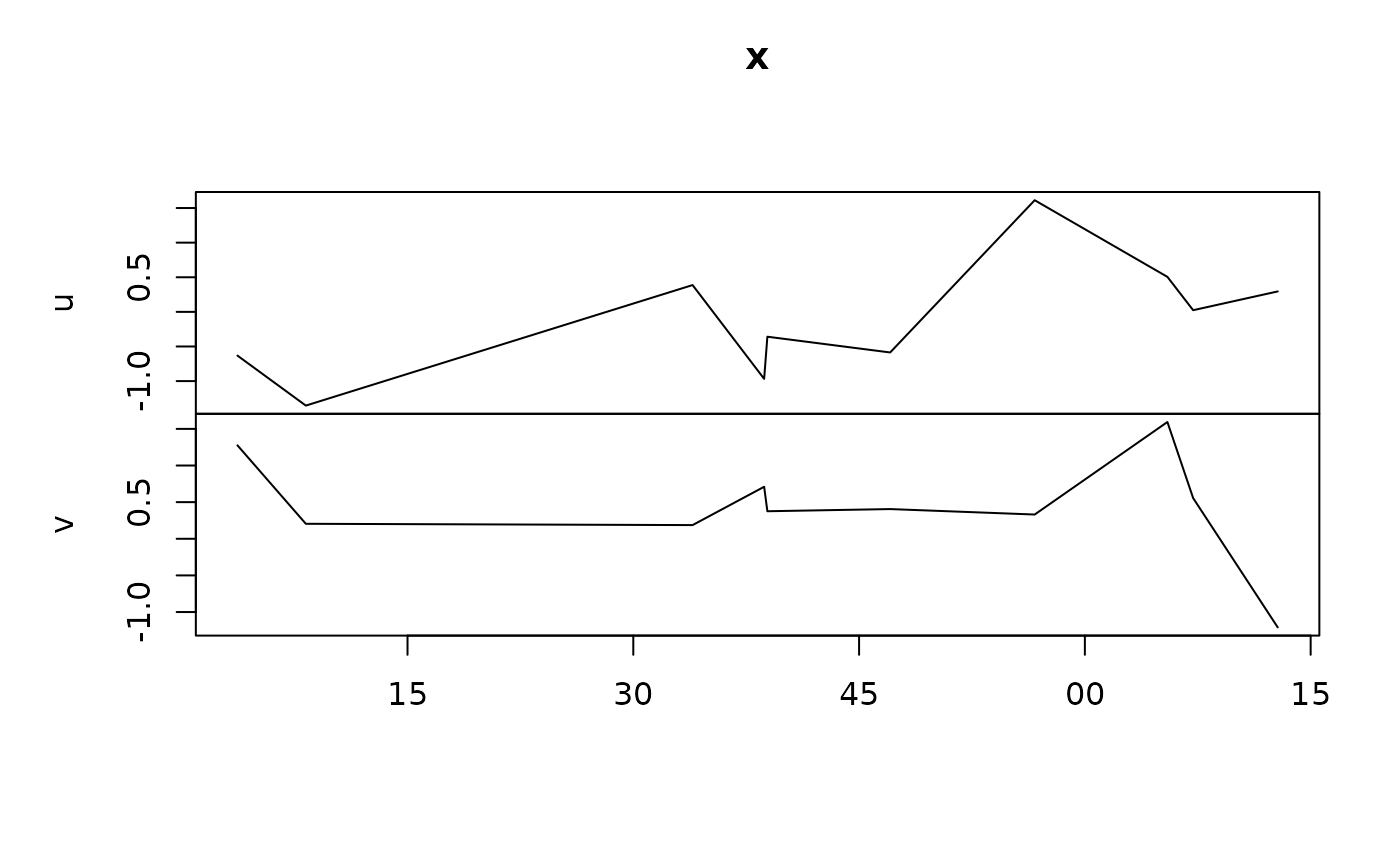
 # Multivariate
t <- cumsum(rexp(n, rate = 0.1))
u <- rnorm(n)
v <- rnorm(n)
x <- irts(t, cbind(u, v))
x
#> 1970-01-01 00:00:03 GMT -0.6317 1.275
#> 1970-01-01 00:00:08 GMT -1.354 0.2045
#> 1970-01-01 00:00:33 GMT 0.3871 0.1867
#> 1970-01-01 00:00:38 GMT -0.9677 0.7097
#> 1970-01-01 00:00:38 GMT -0.3588 0.3758
#> 1970-01-01 00:00:47 GMT -0.5864 0.4054
#> 1970-01-01 00:00:56 GMT 1.613 0.331
#> 1970-01-01 00:01:05 GMT 0.5057 1.594
#> 1970-01-01 00:01:07 GMT 0.02411 0.5551
#> 1970-01-01 00:01:12 GMT 0.2954 -1.209
x[,1]
#> 1970-01-01 00:00:03 GMT -0.6317
#> 1970-01-01 00:00:08 GMT -1.354
#> 1970-01-01 00:00:33 GMT 0.3871
#> 1970-01-01 00:00:38 GMT -0.9677
#> 1970-01-01 00:00:38 GMT -0.3588
#> 1970-01-01 00:00:47 GMT -0.5864
#> 1970-01-01 00:00:56 GMT 1.613
#> 1970-01-01 00:01:05 GMT 0.5057
#> 1970-01-01 00:01:07 GMT 0.02411
#> 1970-01-01 00:01:12 GMT 0.2954
x[1:3,]
#> 1970-01-01 00:00:03 GMT -0.6317 1.275
#> 1970-01-01 00:00:08 GMT -1.354 0.2045
#> 1970-01-01 00:00:33 GMT 0.3871 0.1867
x[1:3,1]
#> 1970-01-01 00:00:03 GMT -0.6317
#> 1970-01-01 00:00:08 GMT -1.354
#> 1970-01-01 00:00:33 GMT 0.3871
plot(x)
# Multivariate
t <- cumsum(rexp(n, rate = 0.1))
u <- rnorm(n)
v <- rnorm(n)
x <- irts(t, cbind(u, v))
x
#> 1970-01-01 00:00:03 GMT -0.6317 1.275
#> 1970-01-01 00:00:08 GMT -1.354 0.2045
#> 1970-01-01 00:00:33 GMT 0.3871 0.1867
#> 1970-01-01 00:00:38 GMT -0.9677 0.7097
#> 1970-01-01 00:00:38 GMT -0.3588 0.3758
#> 1970-01-01 00:00:47 GMT -0.5864 0.4054
#> 1970-01-01 00:00:56 GMT 1.613 0.331
#> 1970-01-01 00:01:05 GMT 0.5057 1.594
#> 1970-01-01 00:01:07 GMT 0.02411 0.5551
#> 1970-01-01 00:01:12 GMT 0.2954 -1.209
x[,1]
#> 1970-01-01 00:00:03 GMT -0.6317
#> 1970-01-01 00:00:08 GMT -1.354
#> 1970-01-01 00:00:33 GMT 0.3871
#> 1970-01-01 00:00:38 GMT -0.9677
#> 1970-01-01 00:00:38 GMT -0.3588
#> 1970-01-01 00:00:47 GMT -0.5864
#> 1970-01-01 00:00:56 GMT 1.613
#> 1970-01-01 00:01:05 GMT 0.5057
#> 1970-01-01 00:01:07 GMT 0.02411
#> 1970-01-01 00:01:12 GMT 0.2954
x[1:3,]
#> 1970-01-01 00:00:03 GMT -0.6317 1.275
#> 1970-01-01 00:00:08 GMT -1.354 0.2045
#> 1970-01-01 00:00:33 GMT 0.3871 0.1867
x[1:3,1]
#> 1970-01-01 00:00:03 GMT -0.6317
#> 1970-01-01 00:00:08 GMT -1.354
#> 1970-01-01 00:00:33 GMT 0.3871
plot(x)