Maximum Drawdown or Maximum Loss
maxdrawdown.RdThis function computes the maximum drawdown or maximum loss of the
univariate time series (or vector) x.
maxdrawdown(x)Details
The max drawdown or max loss statistic is defined as the maximum
value drop after one of the peaks of x. For financial
instruments the max drawdown represents the worst investment loss for
a buy-and-hold strategy invested in x.
Value
A list containing the following three components:
- maxdrawdown
double representing the max drawdown or max loss statistic.
- from
the index (or vector of indices) where the max drawdown period starts.
- to
the index (or vector of indices) where the max drawdown period ends.
See also
Examples
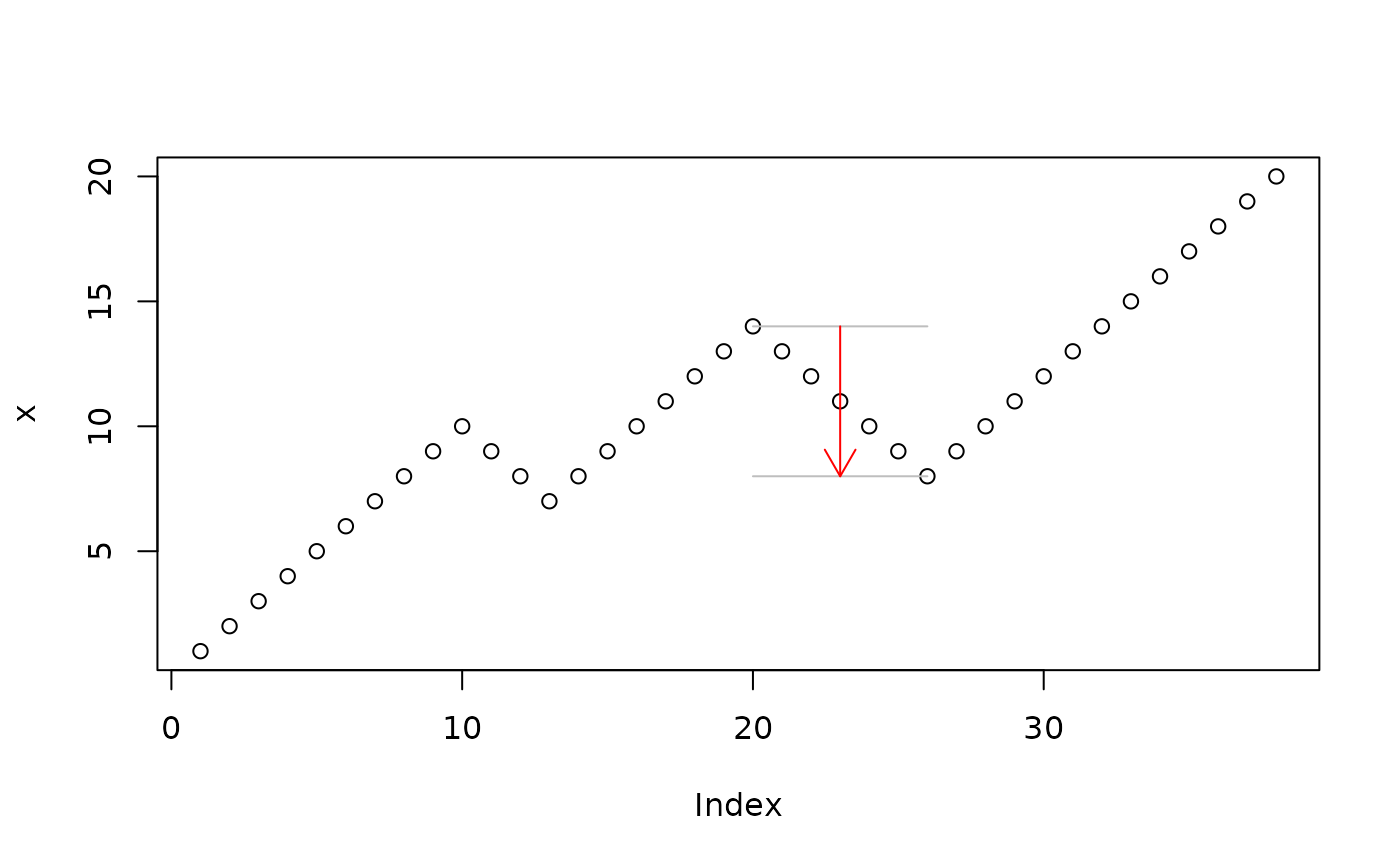
# Toy example
x <- c(1:10, 9:7, 8:14, 13:8, 9:20)
mdd <- maxdrawdown(x)
mdd
#> $maxdrawdown
#> [1] 6
#>
#> $from
#> [1] 20
#>
#> $to
#> [1] 26
#>
plot(x)
segments(mdd$from, x[mdd$from], mdd$to, x[mdd$from], col="grey")
segments(mdd$from, x[mdd$to], mdd$to, x[mdd$to], col="grey")
mid <- (mdd$from + mdd$to)/2
arrows(mid, x[mdd$from], mid, x[mdd$to], col="red", length = 0.16)
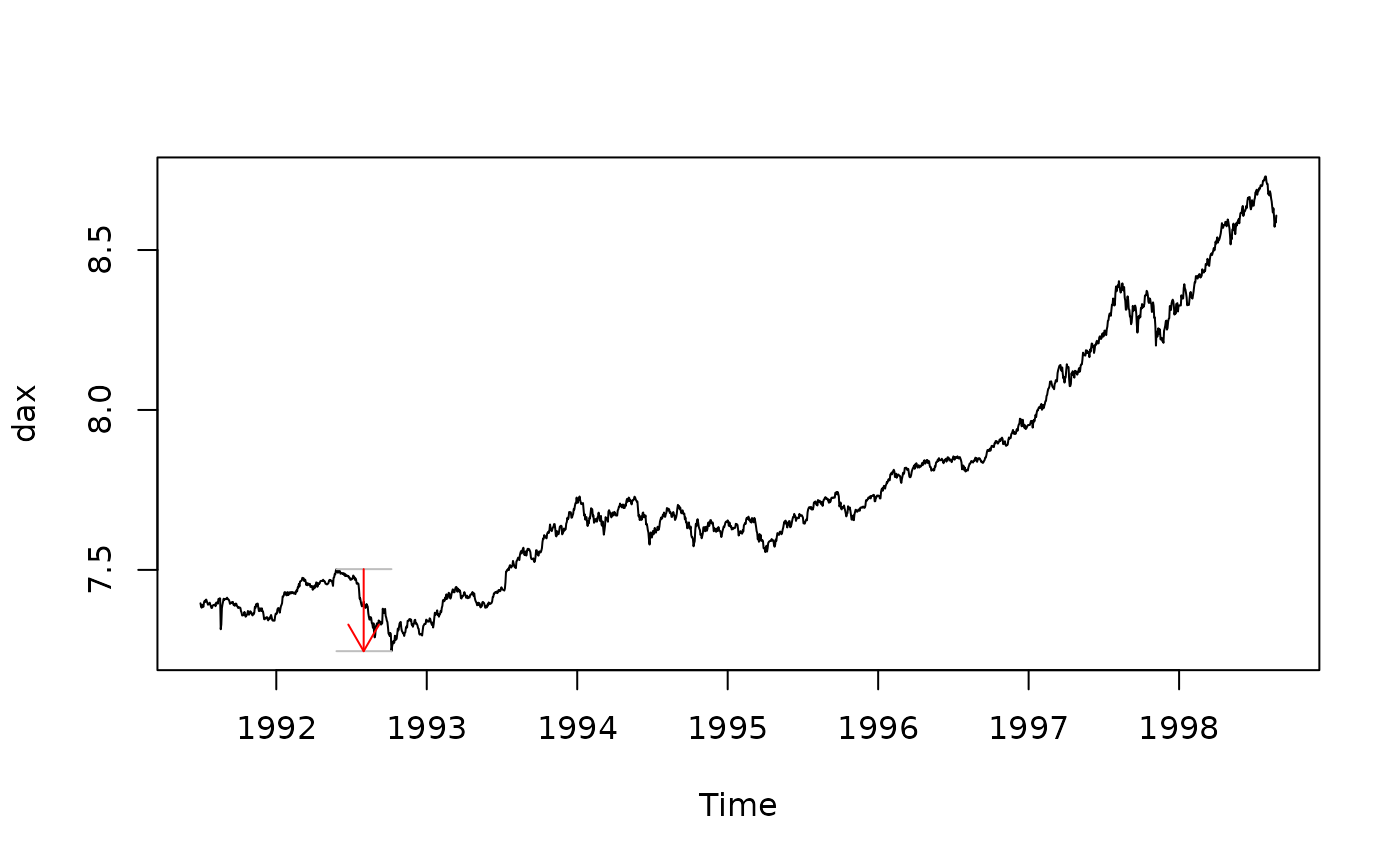
 # Realistic example
data(EuStockMarkets)
dax <- log(EuStockMarkets[,"DAX"])
mdd <- maxdrawdown(dax)
mdd
#> $maxdrawdown
#> [1] 0.256471
#>
#> $from
#> [1] 236
#>
#> $to
#> [1] 331
#>
plot(dax)
segments(time(dax)[mdd$from], dax[mdd$from],
time(dax)[mdd$to], dax[mdd$from], col="grey")
segments(time(dax)[mdd$from], dax[mdd$to],
time(dax)[mdd$to], dax[mdd$to], col="grey")
mid <- time(dax)[(mdd$from + mdd$to)/2]
arrows(mid, dax[mdd$from], mid, dax[mdd$to], col="red", length = 0.16)
# Realistic example
data(EuStockMarkets)
dax <- log(EuStockMarkets[,"DAX"])
mdd <- maxdrawdown(dax)
mdd
#> $maxdrawdown
#> [1] 0.256471
#>
#> $from
#> [1] 236
#>
#> $to
#> [1] 331
#>
plot(dax)
segments(time(dax)[mdd$from], dax[mdd$from],
time(dax)[mdd$to], dax[mdd$from], col="grey")
segments(time(dax)[mdd$from], dax[mdd$to],
time(dax)[mdd$to], dax[mdd$to], col="grey")
mid <- time(dax)[(mdd$from + mdd$to)/2]
arrows(mid, dax[mdd$from], mid, dax[mdd$to], col="red", length = 0.16)