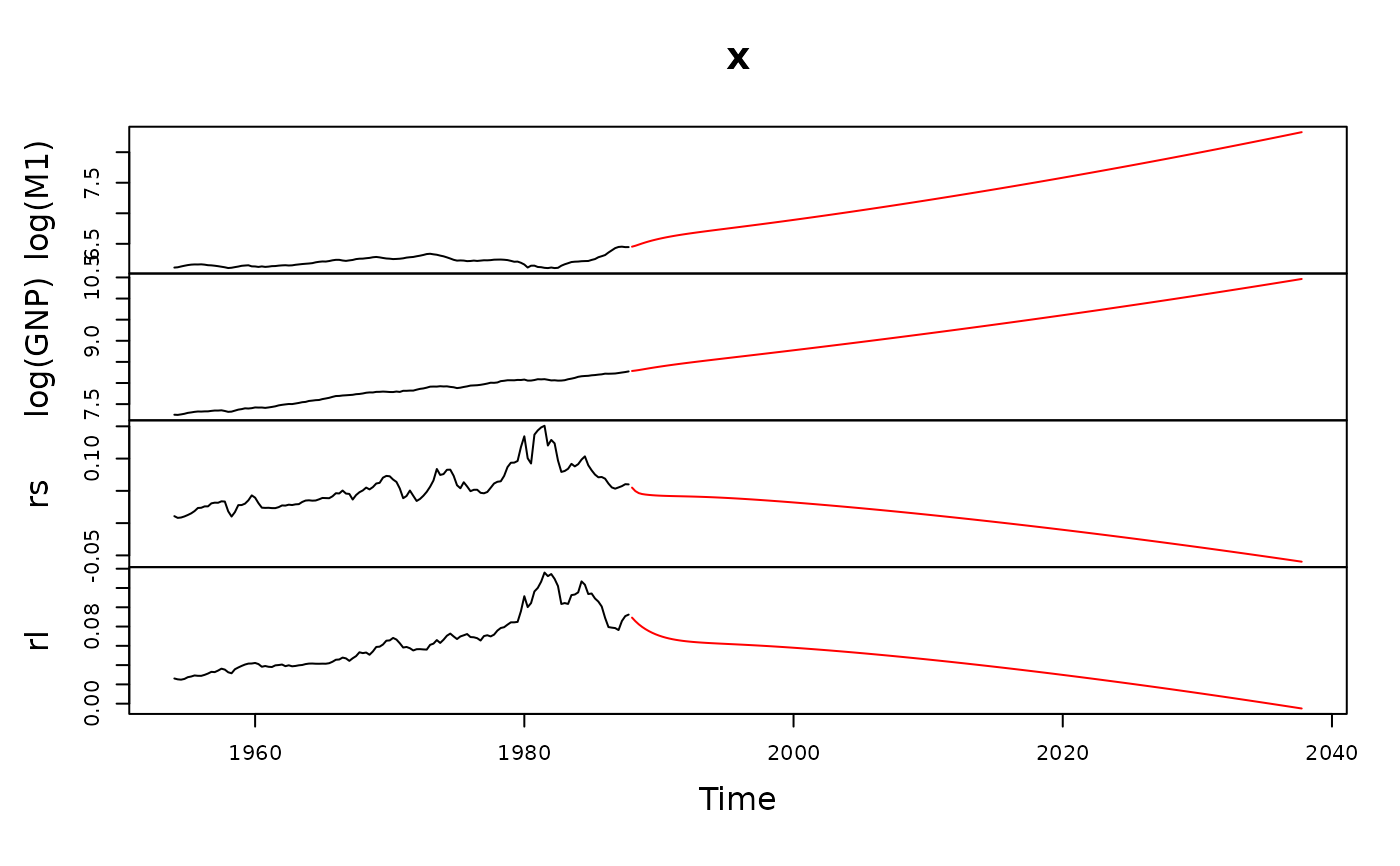
Plot Two Time Series
seqplot.ts.RdPlot two time series on the same plot frame.
seqplot.ts(x, y, colx = "black", coly = "red", typex = "l",
           typey = "l", pchx = 1, pchy = 1, ltyx = "solid",
           ltyy = "solid", oma = c(6, 0, 5, 0), ann = par("ann"),
           xlab = "Time", ylab = deparse(substitute(x)), main = NULL)
Arguments
- x, y
the time series.
- colx, coly
color code or name for the
xandyseries, seecolors,palette.- typex, typey
what type of plot should be drawn for the
xandyseries, seeplot.- pchx, pchy
character or integer code for kind of points/lines for the
xandyseries.- ltyx, ltyy
line type code for the
xandyseries, seelines.- oma
a vector giving the size of the outer margins in lines of text, see
par.- ann
annotate the plots? See
par.- xlab, ylab
titles for the x and y axis.
- main
an overall title for the plot.
Details
Unlike plot.ts the series can have different time bases,
but they should have the same frequency. Unlike ts.plot
the series can be plotted in different styles and for multivariate
x and y the common variables are plotted together in a
separate array element.
Value
None.