Creates a VPC plot from observed and simulation data for categorical variables.
vpc_cat(
  sim = NULL,
  obs = NULL,
  psn_folder = NULL,
  bins = "jenks",
  n_bins = "auto",
  bin_mid = "mean",
  obs_cols = NULL,
  sim_cols = NULL,
  software = "auto",
  show = NULL,
  ci = c(0.05, 0.95),
  uloq = NULL,
  lloq = NULL,
  xlab = NULL,
  ylab = NULL,
  title = NULL,
  smooth = TRUE,
  vpc_theme = NULL,
  facet = "wrap",
  labeller = NULL,
  plot = TRUE,
  vpcdb = FALSE,
  verbose = FALSE
)
Arguments
- sim
a data.frame with observed data, containing the independent and dependent variable, a column indicating the individual, and possibly covariates. E.g. load in from NONMEM using read_table_nm
- obs
a data.frame with observed data, containing the independent and dependent variable, a column indicating the individual, and possibly covariates. E.g. load in from NONMEM using read_table_nm
- psn_folder
instead of specifying "sim" and "obs", specify a PsN-generated VPC-folder
- bins
either "density", "time", or "data", "none", or one of the approaches available in classInterval() such as "jenks" (default) or "pretty", or a numeric vector specifying the bin separators.
- n_bins
when using the "auto" binning method, what number of bins to aim for
- bin_mid
either "mean" for the mean of all timepoints (default) or "middle" to use the average of the bin boundaries.
- obs_cols
observation dataset column names (list elements: "dv", "idv", "id", "pred")
- sim_cols
simulation dataset column names (list elements: "dv", "idv", "id", "pred")
- software
name of software platform using (e.g. nonmem, phoenix)
- show
what to show in VPC (obs_ci, pi, pi_as_area, pi_ci, obs_median, sim_median, sim_median_ci)
- ci
confidence interval to plot. Default is (0.05, 0.95)
- uloq
Number or NULL indicating upper limit of quantification. Default is NULL.
- lloq
Number or NULL indicating lower limit of quantification. Default is NULL.
- xlab
label for x-axis
- ylab
label for y-axis
- title
title
- smooth
"smooth" the VPC (connect bin midpoints) or show bins as rectangular boxes. Default is TRUE.
- vpc_theme
theme to be used in VPC. Expects list of class vpc_theme created with function vpc_theme()
- facet
either "wrap", "columns", or "rows"
- labeller
ggplot2 labeller function to be passed to underlying ggplot object
- plot
Boolean indicting whether to plot the ggplot2 object after creation. Default is FALSE.
- vpcdb
boolean whether to return the underlying vpcdb rather than the plot
- verbose
show debugging information (TRUE or FALSE)
Value
a list containing calculated VPC information (when vpcdb=TRUE), or a ggplot2 object (default)
Examples
## See vpc.ronkeizer.com for more documentation and examples
library(vpc)
# simple function to simulate categorical data for single individual
sim_id <- function(id = 1) {
n <- 10
logit <- function(x) exp(x) / (1+exp(x))
data.frame(id = id, time = seq(1, n, length.out = n),
dv = round(logit((1:n) - n/2 + rnorm(n, 0, 1.5))) )
}
## simple function to simulate categorical data for a trial
sim_trial <- function(i = 1, n = 20) { # function to simulate categorical data for a trial
data.frame(sim = i, do.call("rbind", lapply(1:n, sim_id)))
}
## simulate single trial for 20 individuals
obs <- sim_trial(n = 20)
## simulate 200 trials of 20 individuals
sim <- do.call("rbind", lapply(1:200, sim_trial, n = 20))
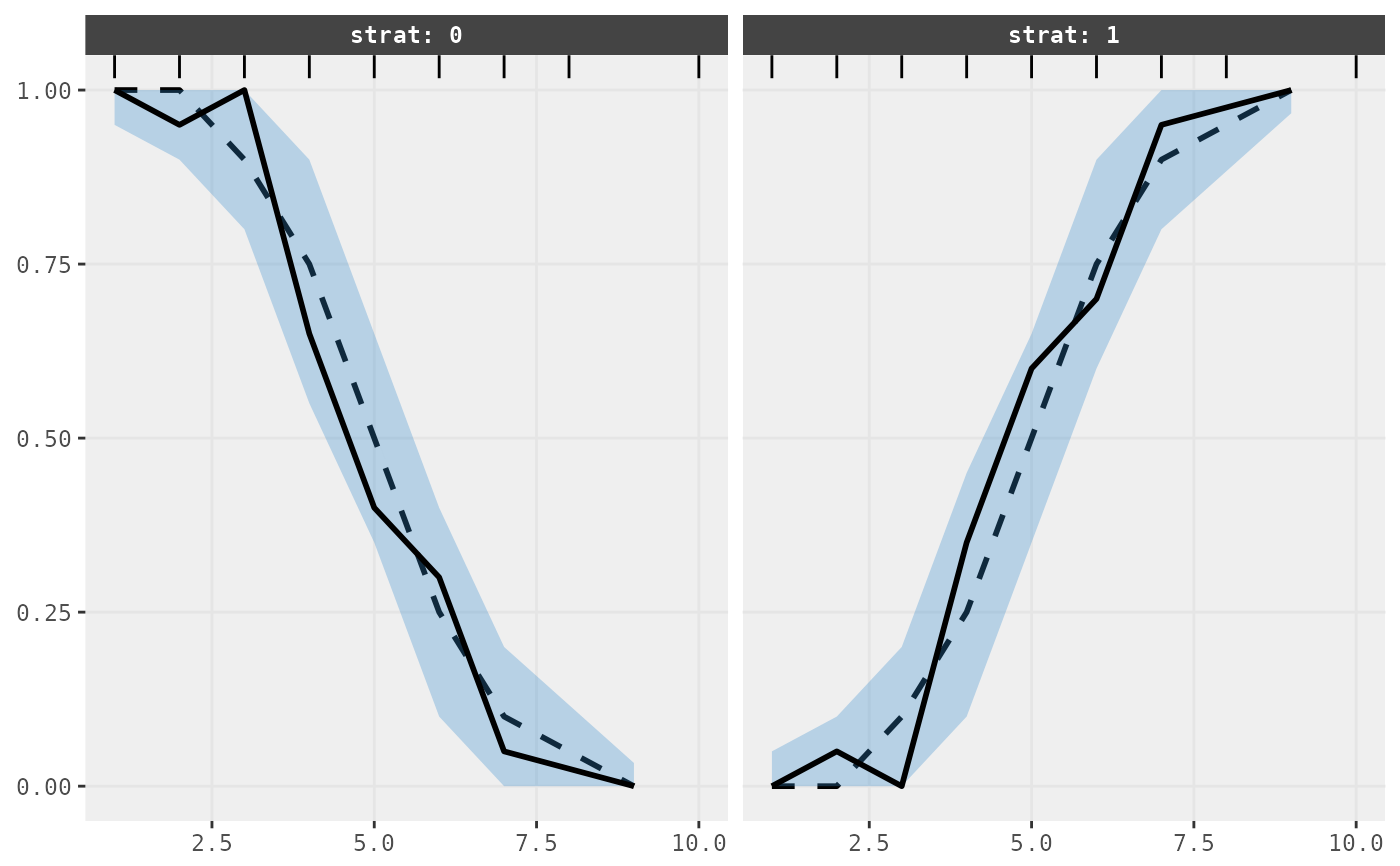
## Plot categorical VPC
vpc_cat(sim = sim, obs = obs)
#> Warning: Nothing named: median_ci found to replace