Create a new xgx plot
Usage
xgx_plot(
  data = NULL,
  mapping = ggplot2::aes(),
  ...,
  environment = parent.frame()
)
Arguments
- data
Default dataset to use for plot. If not already a data.frame, will be converted to one by fortify.
- mapping
As in ggplot2; Default list of aesthetic mappings to use for plot. Must define x, y, and group for xgx_spaghetti.
- ...
Other arguments passed on to methods. Not currently used.
- environment
If an variable defined in the aesthetic mapping is not found in the data, ggplot will look for it in this environment. It defaults to using the environment in which
ggplotis called.
Examples
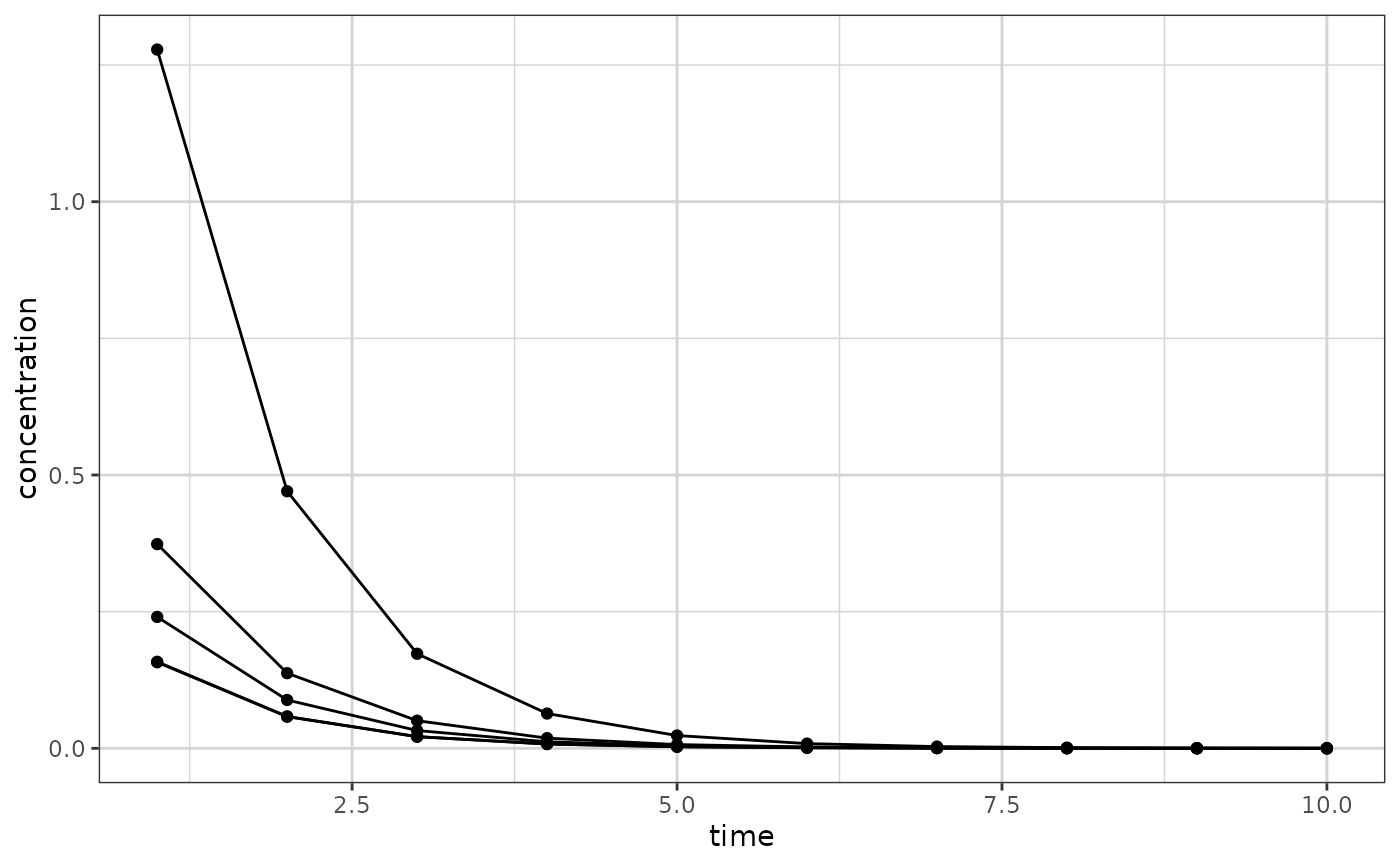
time <- rep(seq(1, 10), 5)
id <- sort(rep(seq(1, 5), 10))
conc <- exp(-time) * sort(rep(stats::rlnorm(5), 10))

data <- data.frame(time = time, concentration = conc, id = id)
xgx_plot(data = data,
         mapping = ggplot2::aes(x = time, y = concentration, group = id)) +
  ggplot2::geom_line() +
  ggplot2::geom_point()