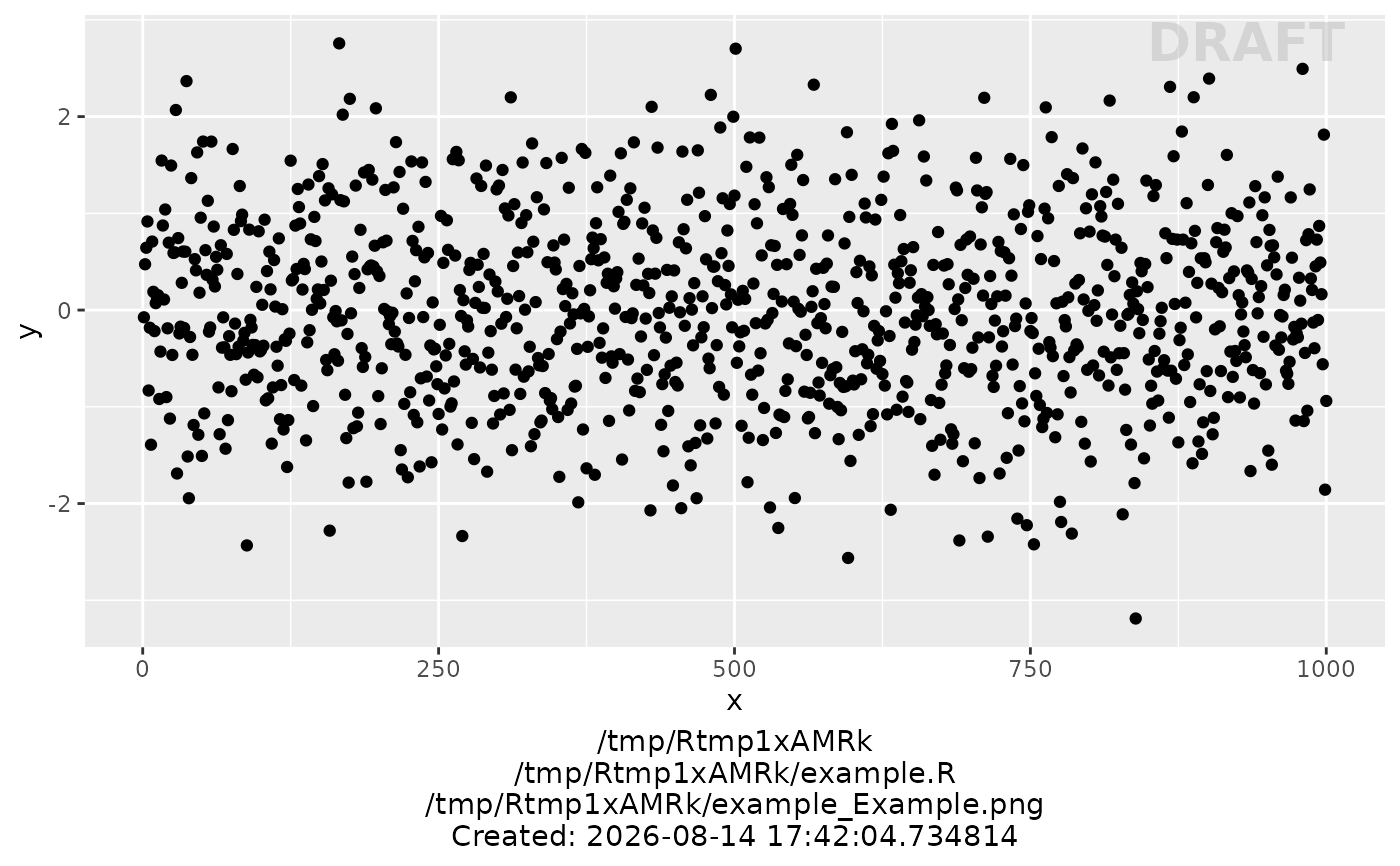
Saving plot, automatically annotating the status and denoting the filenames
Source:R/xgx_save.R
xgx_save.RdSaving plot, automatically annotating the status and denoting the filenames
Usage
xgx_save(
  width,
  height,
  dirs = NULL,
  filename_main = NULL,
  status = "DRAFT",
  g = ggplot2::last_plot(),
  filetype = "png",
  status_x = Inf,
  status_y = Inf,
  status_fontsize = 7,
  status_fontcolor = "grey",
  filenames_fontsize = 11,
  filenames_fontcolor = "black"
)
Arguments
- width
width of plot
- height
height of plot
- dirs
list of directories. If NULL or if directories missing, there is default behavior below
parent_dir = Parent directory containing the Rscript and the Results folder, default getwd()
rscript_dir = Subdirectory of parent_dir that contains the Rscript used to generate the figure, default "./"
rscript_name= Name of the Rscript used to generate the figure, default "Name_Of_Script_Here.R"
results_dir = Subdirectory ofparent_dir where the figure is stored, default "./"
filename_prefix = prefix of filename to be appended to filename_main
- filename_main
main part of the filename, excluding prefix and suffix. no default
- status
status to be annotated
- g
ggplot plot object, default is ggplot::last_plot()
- filetype
file extension (e.g. "pdf","csv" etc.)
- status_x
x location of the status in plot
- status_y
y location of the status in plot
- status_fontsize
font size for status in plot
- status_fontcolor
font color for status in plot
- filenames_fontsize
font size for filenames info in plot
- filenames_fontcolor
font color for filenames info in plot
Examples
directory = tempdir()
dirs <- list(parent_dir = directory,
rscript_dir = directory,
rscript_name = "example.R",
results_dir = directory,
filename_prefix = "example_")
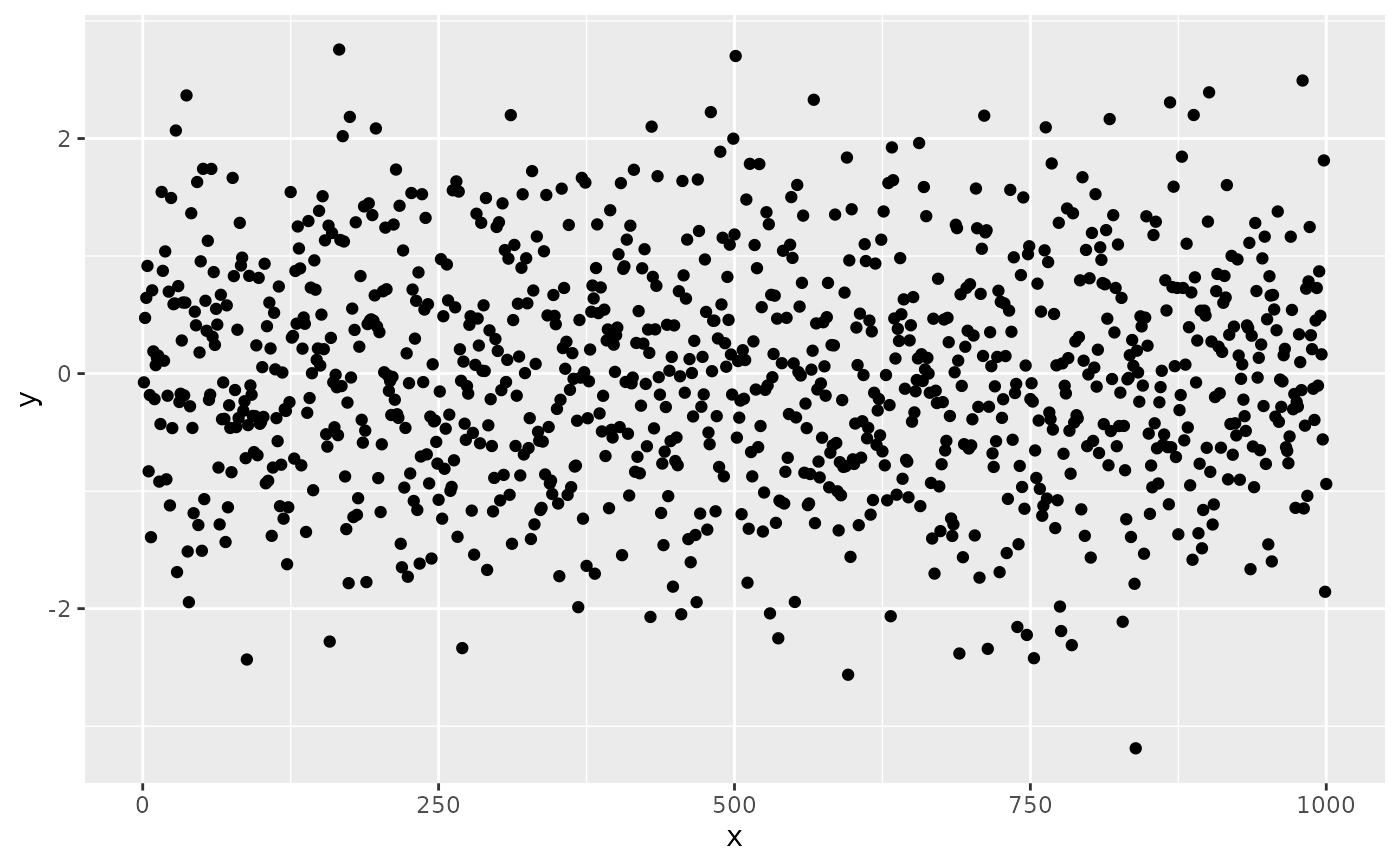
data <- data.frame(x = 1:1000, y = stats::rnorm(1000))
ggplot2::ggplot(data = data, ggplot2::aes(x = x, y = y)) +
ggplot2::geom_point()
 xgx_save(4, 4, dirs, "Example", "DRAFT")