xgx_scale_x_time_units converts x axis scale from one time unit
to another.
Supported units include hours, days, weeks, months, and years, which
can also be called using just the first letter (h, d, w, m, y).
Usage
xgx_scale_x_time_units(
  units_dataset,
  units_plot = NULL,
  breaks = NULL,
  labels = NULL,
  ...
)

xgx_scale_y_time_units(
  units_dataset,
  units_plot = NULL,
  breaks = NULL,
  labels = NULL,
  ...
)
Arguments
- units_dataset
units of the input dataset, must be specified by user as "h", "d", "w", "m", or "y"
- units_plot
units of the plot, will be units of the dataset if empty
- breaks
One of:
NULLfor no breakswaiver()for the default breaks computed by the transformation objectA numeric vector of positions
A function that takes the limits as input and returns breaks as output (e.g., a function returned by
scales::extended_breaks()). Note that for position scales, limits are provided after scale expansion. Also accepts rlang lambda function notation.
- labels
One of the options below. Please note that when
labelsis a vector, it is highly recommended to also set thebreaksargument as a vector to protect against unintended mismatches.NULLfor no labelswaiver()for the default labels computed by the transformation objectA character vector giving labels (must be same length as
breaks)An expression vector (must be the same length as breaks). See ?plotmath for details.
A function that takes the breaks as input and returns labels as output. Also accepts rlang lambda function notation.
- ...
other parameters for
scale_x_continuous
Details
Note: xgx_scale_x_time_units only scales the plot axis, all other
specifications must be on the original scale of the dataset (e.g. breaks,
position, width)
Examples
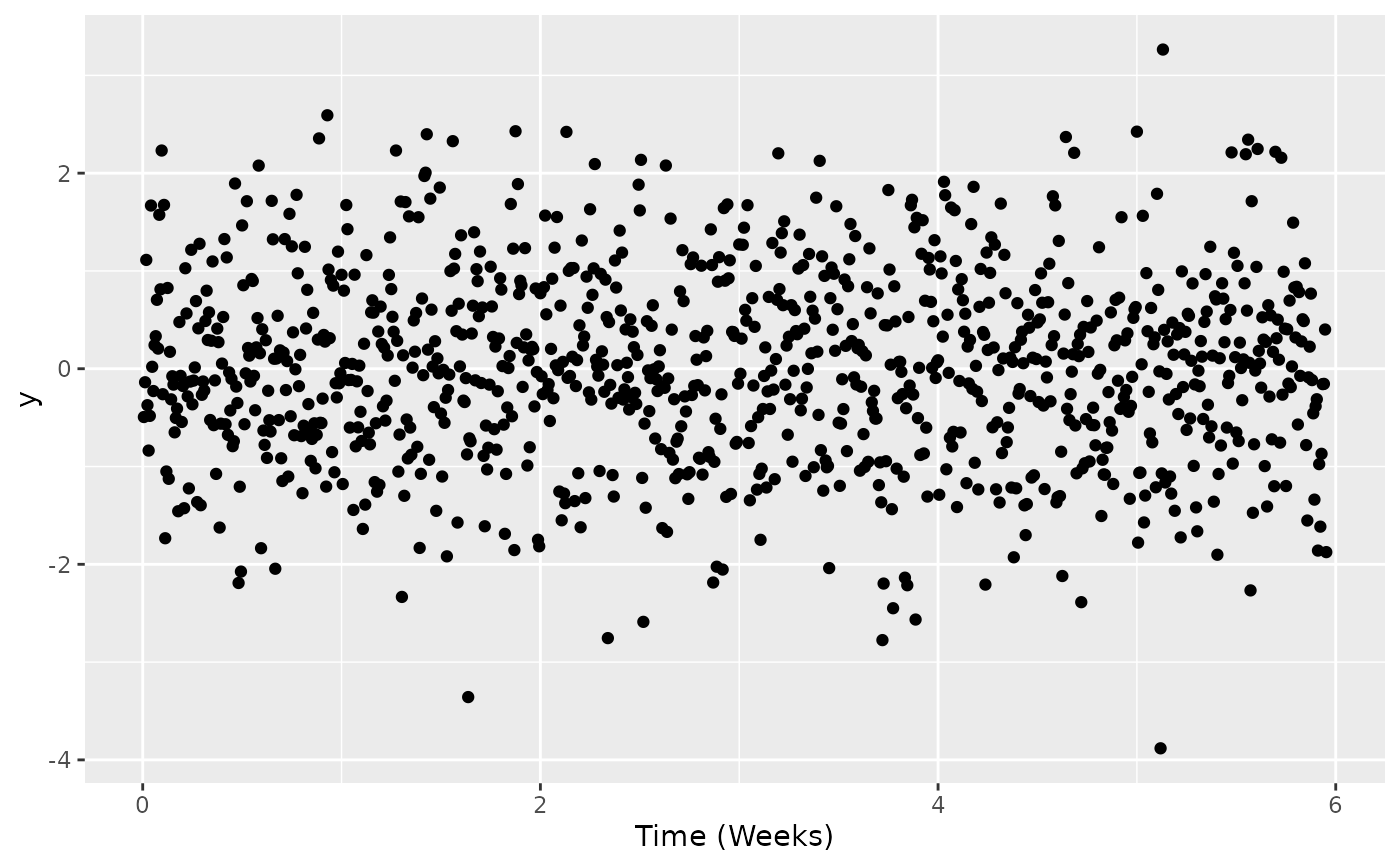
data <- data.frame(x = 1:1000, y = rnorm(1000))
ggplot2::ggplot(data = data, ggplot2::aes(x = x, y = y)) +
  ggplot2::geom_point() +
  xgx_scale_x_time_units(units_dataset = "hours", units_plot = "weeks")