Zero-Altered Binomial Distribution
zabinomUC.RdDensity, distribution function, quantile function and random
generation for the zero-altered binomial distribution with
parameter pobs0.
dzabinom(x, size, prob, pobs0 = 0, log = FALSE)
pzabinom(q, size, prob, pobs0 = 0)
qzabinom(p, size, prob, pobs0 = 0)
rzabinom(n, size, prob, pobs0 = 0)
Arguments
- x, q
vector of quantiles.
- p
vector of probabilities.
- n
number of observations. If
length(n) > 1then the length is taken to be the number required.- size, prob, log
Parameters from the ordinary binomial distribution (see
dbinom).- pobs0
Probability of (an observed) zero, called \(pobs0\). The default value of
pobs0 = 0corresponds to the response having a positive binomial distribution.
Details
The probability function of \(Y\) is 0 with probability
pobs0, else a positive binomial(size, prob) distribution.
Value
dzabinom gives the density and
pzabinom gives the distribution function,
qzabinom gives the quantile function, and
rzabinom generates random deviates.
Note
The argument pobs0 is recycled to the required length,
and must have values which lie in the interval \([0,1]\).
See also
Examples
size <- 10; prob <- 0.15; pobs0 <- 0.05; x <- (-1):7
dzabinom(x, size = size, prob = prob, pobs0 = pobs0)
#> [1] 0.0000000000 0.0500000000 0.4109620590 0.3263522233 0.1535775169
#> [6] 0.0474283508 0.0100436508 0.0014770075 0.0001489419
table(rzabinom(100, size = size, prob = prob, pobs0 = pobs0))
#>
#> 0 1 2 3 4 5
#> 5 37 39 15 2 2
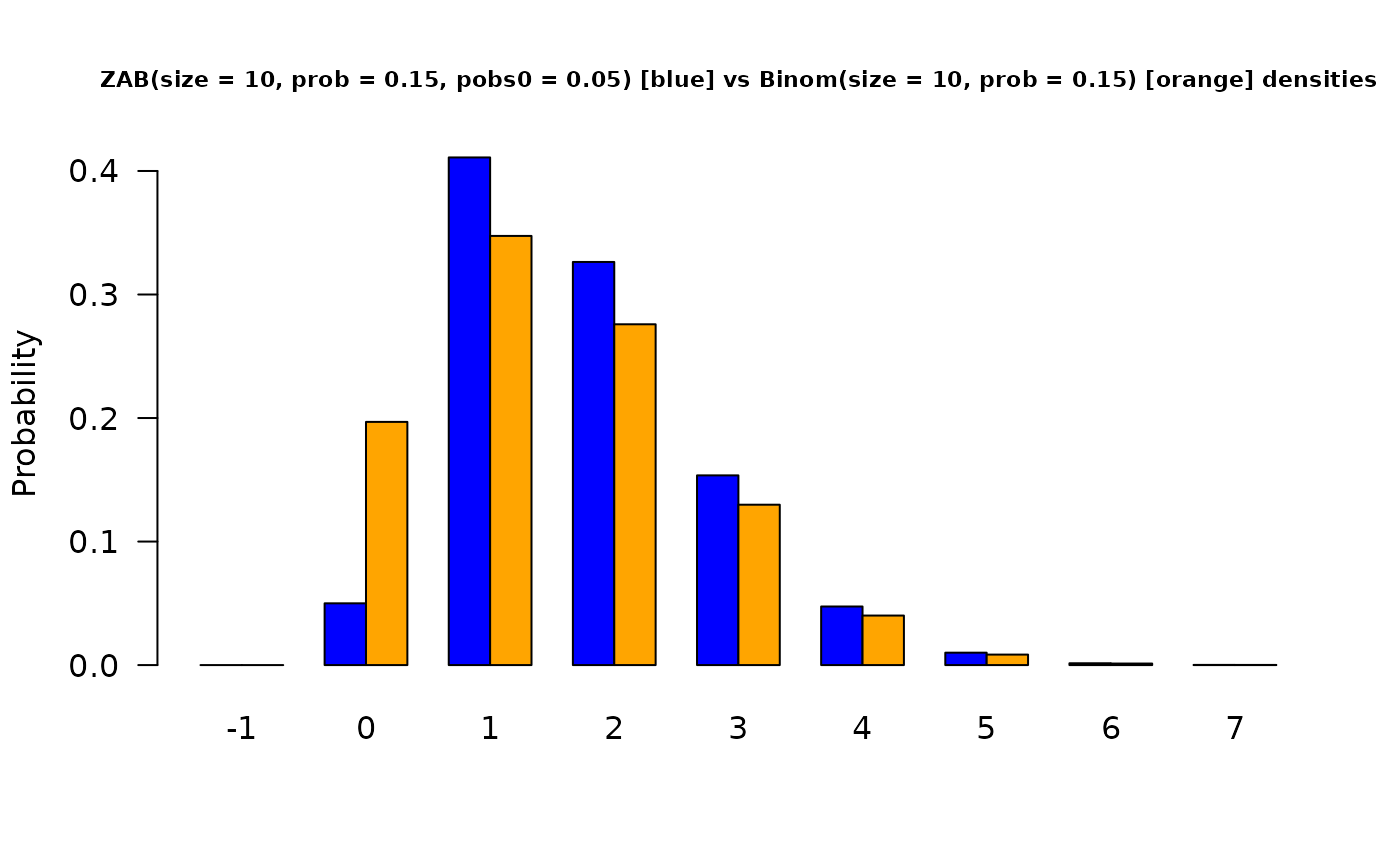
if (FALSE) x <- 0:10
barplot(rbind(dzabinom(x, size = size, prob = prob, pobs0 = pobs0),
dbinom(x, size = size, prob = prob)),
beside = TRUE, col = c("blue", "orange"), cex.main = 0.7, las = 1,
ylab = "Probability", names.arg = as.character(x),
main = paste("ZAB(size = ", size, ", prob = ", prob, ", pobs0 = ", pobs0,
") [blue] vs", " Binom(size = ", size, ", prob = ", prob,
") [orange] densities", sep = "")) # \dontrun{}