Zero-Altered Poisson Distribution
zapoisUC.RdDensity, distribution function, quantile function and random
generation for the zero-altered Poisson distribution with
parameter pobs0.
dzapois(x, lambda, pobs0 = 0, log = FALSE)
pzapois(q, lambda, pobs0 = 0)
qzapois(p, lambda, pobs0 = 0)
rzapois(n, lambda, pobs0 = 0)
Arguments
- x, q
vector of quantiles.
- p
vector of probabilities.
- n
number of observations. If
length(n) > 1then the length is taken to be the number required.- lambda
Vector of positive means.
- pobs0
Probability of zero, called \(pobs0\). The default value of
pobs0 = 0corresponds to the response having a positive Poisson distribution.- log
Logical. Return the logarithm of the answer?
Details
The probability function of \(Y\) is 0 with probability
pobs0, else a positive
\(Poisson(\lambda)\).
Value
dzapois gives the density,
pzapois gives the distribution function,
qzapois gives the quantile function, and
rzapois generates random deviates.
Note
The argument pobs0 is recycled to the required length,
and must have values which lie in the interval \([0,1]\).
Examples
lambda <- 3; pobs0 <- 0.2; x <- (-1):7
(ii <- dzapois(x, lambda, pobs0))
#> [1] 0.00000000 0.20000000 0.12574967 0.18862451 0.18862451 0.14146838 0.08488103
#> [8] 0.04244051 0.01818879
max(abs(cumsum(ii) - pzapois(x, lambda, pobs0))) # Should be 0
#> [1] 1.110223e-16
table(rzapois(100, lambda, pobs0))
#>
#> 0 1 2 3 4 5 6 7 10
#> 19 8 23 19 19 4 4 3 1
table(qzapois(runif(100), lambda, pobs0))
#>
#> 0 1 2 3 4 5 6 7 10
#> 17 13 16 16 19 11 6 1 1
round(dzapois(0:10, lambda, pobs0) * 100) # Should be similar
#> [1] 20 13 19 19 14 8 4 2 1 0 0
if (FALSE) x <- 0:10
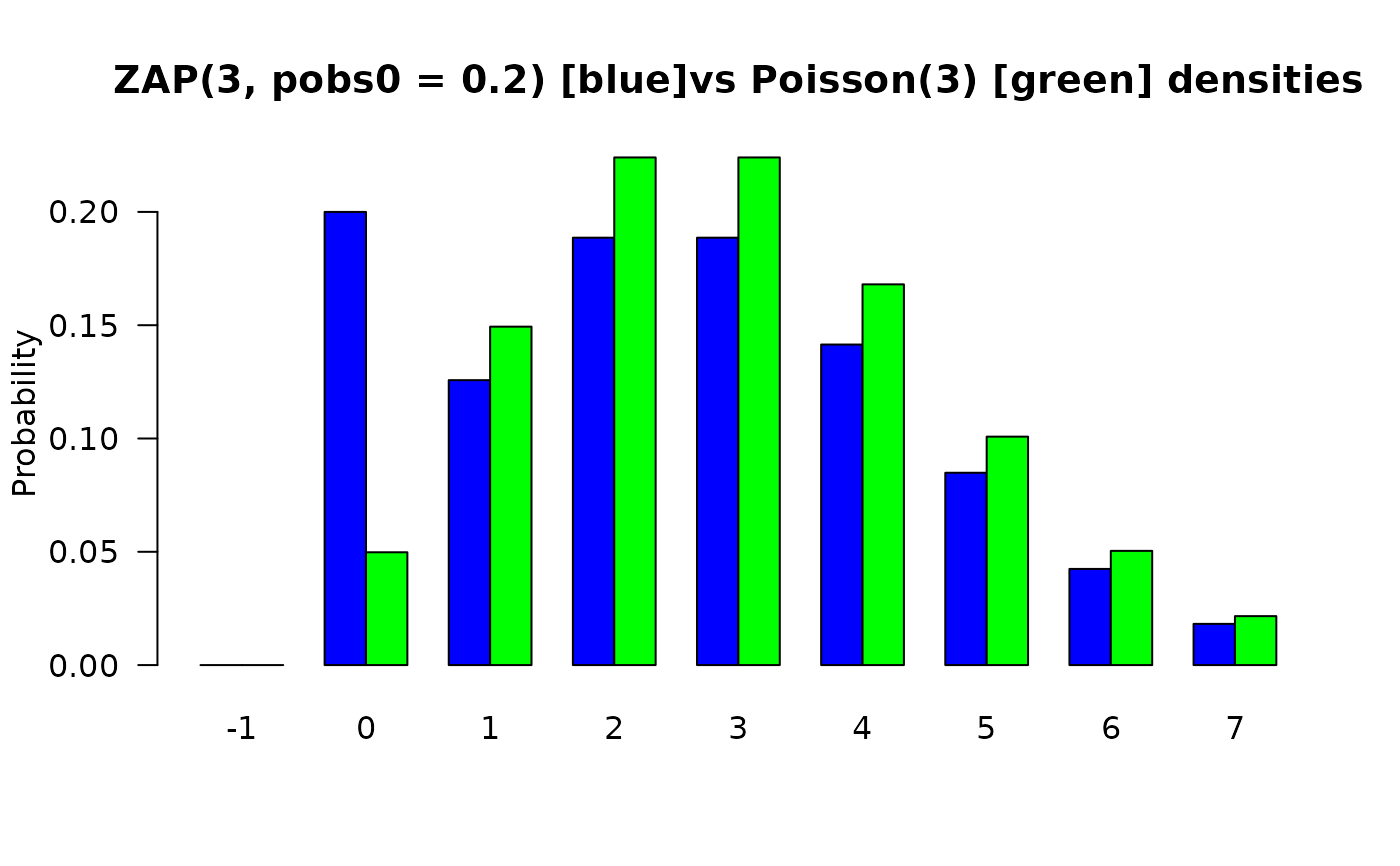
barplot(rbind(dzapois(x, lambda, pobs0), dpois(x, lambda)),
beside = TRUE, col = c("blue", "green"), las = 1,
main = paste0("ZAP(", lambda, ", pobs0 = ", pobs0, ") [blue]",
"vs Poisson(", lambda, ") [green] densities"),
names.arg = as.character(x), ylab = "Probability") # \dontrun{}