Draw rectangles on the correlation matrix graph based on hierarchical cluster
(hclust).
corrRect.hclust(
  corr,
  k = 2,
  col = "black",
  lwd = 2,
  method = c("complete", "ward", "ward.D", "ward.D2", "single", "average", "mcquitty",
    "median", "centroid")
)
Arguments
- corr
Correlation matrix for function
corrRect.hclust. It use1-corras dist in hierarchical clustering (hclust).- k
Integer, the number of rectangles drawn on the graph according to the hierarchical cluster, for function
corrRect.hclust.- col
Color of rectangles.
- lwd
Line width of rectangles.
- method
Character, the agglomeration method to be used for hierarchical clustering (
hclust). This should be (an unambiguous abbreviation of) one of'ward','ward.D','ward.D2','single','complete','average','mcquitty','median'or'centroid'.
Examples
data(mtcars)
M = cor(mtcars)
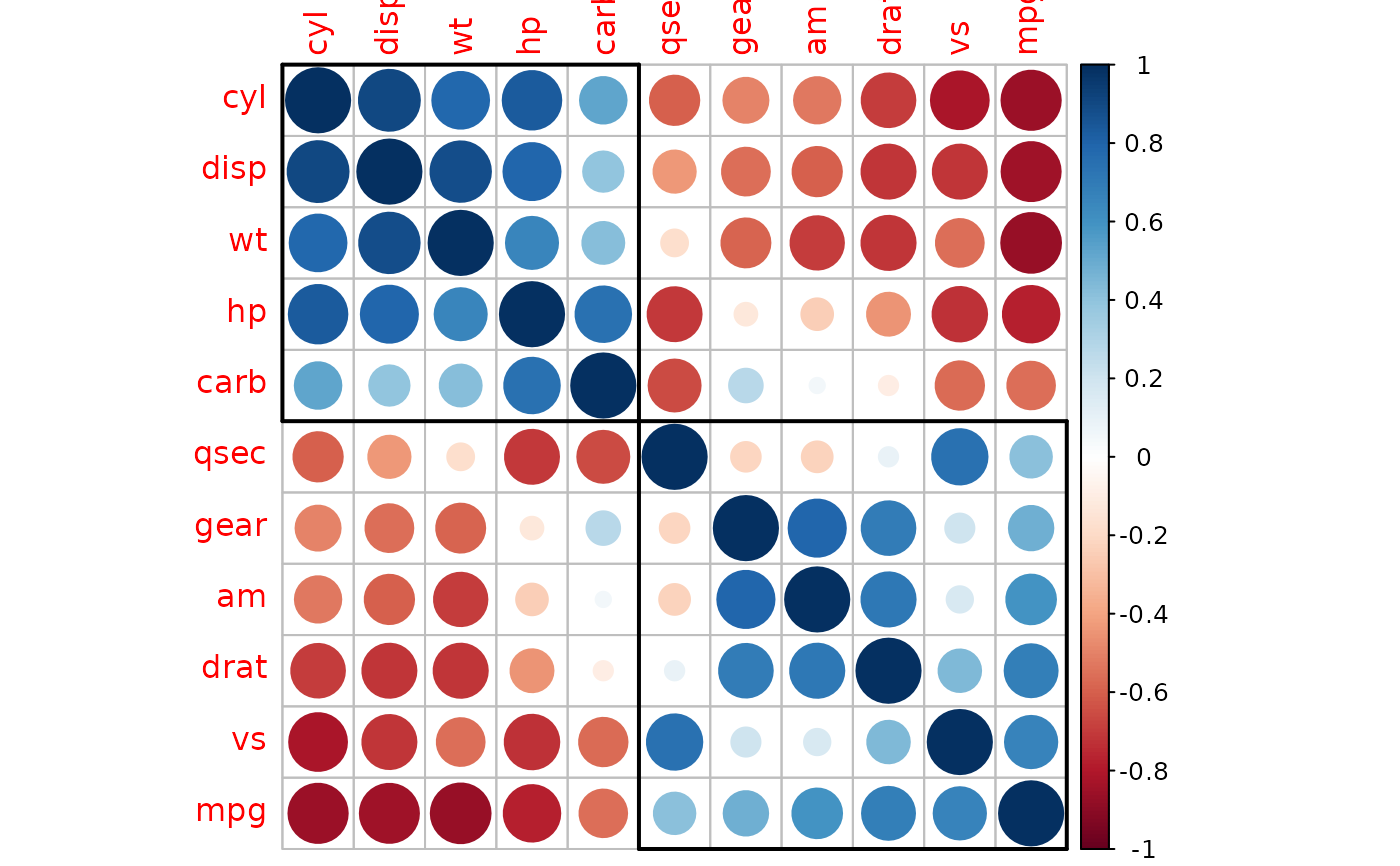
corrplot(M, order = 'FPC') -> p
corrRect(p, index = c(1, 6, 11))
 if(getRversion() >= '4.1.0') {
corrplot(M, order = 'FPC') |> corrRect(index = c(1, 6, 11))
}
(order.hc = corrMatOrder(M, order = 'hclust'))
#> [1] 11 6 4 2 3 7 8 1 5 9 10
(order.hc2 = corrMatOrder(M, order = 'hclust', hclust.method = 'ward.D2'))
#> [1] 6 2 3 4 11 7 8 1 5 9 10
M.hc = M[order.hc, order.hc]
M.hc2 = M[order.hc2, order.hc2]
par(ask = TRUE)
# same as: corrplot(M, order = 'hclust', addrect = 2)
corrplot(M.hc)
corrRect.hclust(corr = M.hc, k = 2)
if(getRversion() >= '4.1.0') {
corrplot(M, order = 'FPC') |> corrRect(index = c(1, 6, 11))
}
(order.hc = corrMatOrder(M, order = 'hclust'))
#> [1] 11 6 4 2 3 7 8 1 5 9 10
(order.hc2 = corrMatOrder(M, order = 'hclust', hclust.method = 'ward.D2'))
#> [1] 6 2 3 4 11 7 8 1 5 9 10
M.hc = M[order.hc, order.hc]
M.hc2 = M[order.hc2, order.hc2]
par(ask = TRUE)
# same as: corrplot(M, order = 'hclust', addrect = 2)
corrplot(M.hc)
corrRect.hclust(corr = M.hc, k = 2)
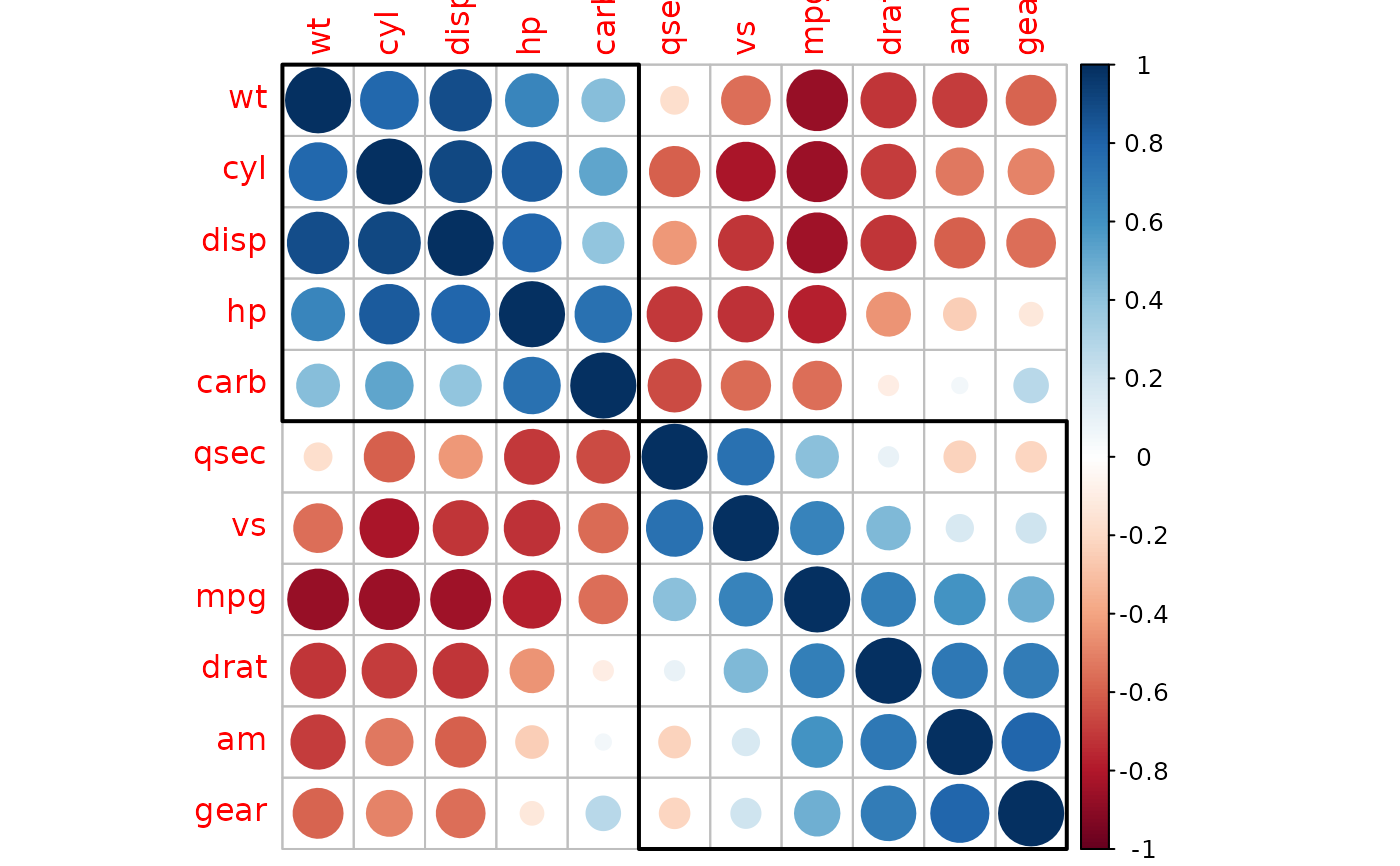
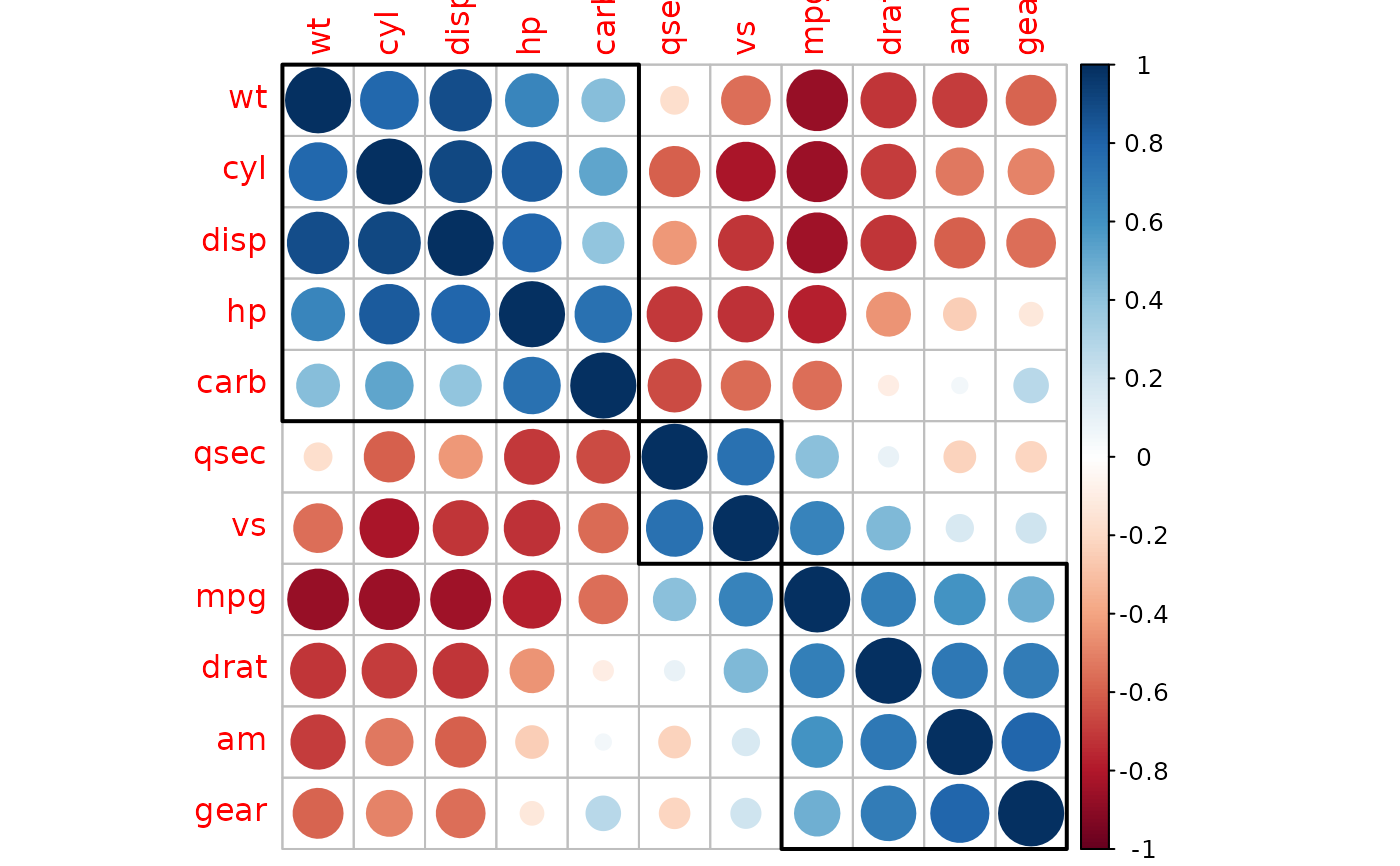
 # same as: corrplot(M, order = 'hclust', addrect = 3)
corrplot(M.hc)
corrRect.hclust(corr = M.hc, k = 3)
# same as: corrplot(M, order = 'hclust', addrect = 3)
corrplot(M.hc)
corrRect.hclust(corr = M.hc, k = 3)
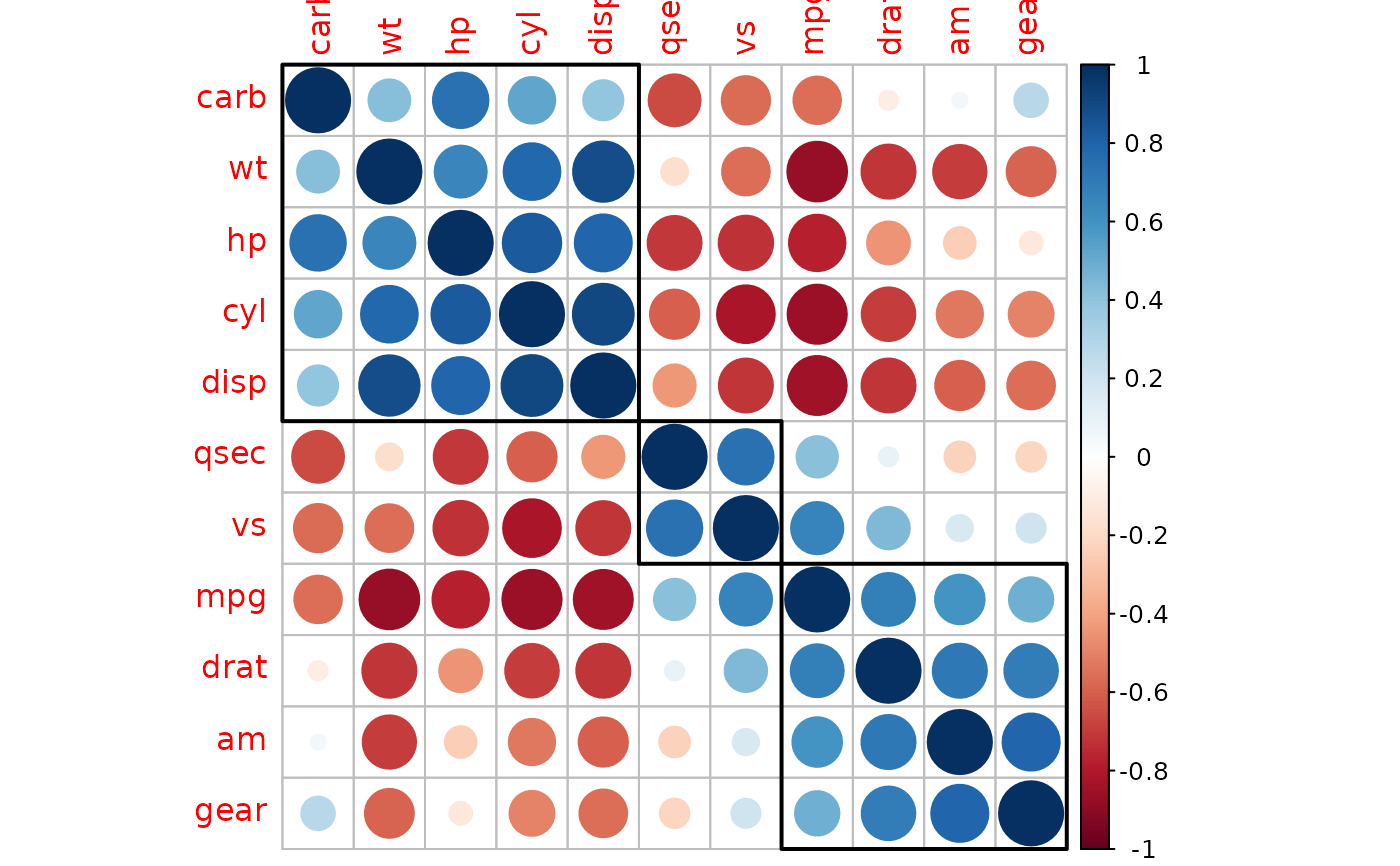 # same as: corrplot(M, order = 'hclust', hclust.method = 'ward.D2', addrect = 2)
corrplot(M.hc2)
corrRect.hclust(M.hc2, k = 2, method = 'ward.D2')
# same as: corrplot(M, order = 'hclust', hclust.method = 'ward.D2', addrect = 2)
corrplot(M.hc2)
corrRect.hclust(M.hc2, k = 2, method = 'ward.D2')
 # same as: corrplot(M, order = 'hclust', hclust.method = 'ward.D2', addrect = 3)
corrplot(M.hc2)
corrRect.hclust(M.hc2, k = 3, method = 'ward.D2')
# same as: corrplot(M, order = 'hclust', hclust.method = 'ward.D2', addrect = 3)
corrplot(M.hc2)
corrRect.hclust(M.hc2, k = 3, method = 'ward.D2')
 # same as: corrplot(M, order = 'hclust', hclust.method = 'ward.D2', addrect = 4)
corrplot(M.hc2)
corrRect.hclust(M.hc2, k = 4, method = 'ward.D2')
# same as: corrplot(M, order = 'hclust', hclust.method = 'ward.D2', addrect = 4)
corrplot(M.hc2)
corrRect.hclust(M.hc2, k = 4, method = 'ward.D2')
