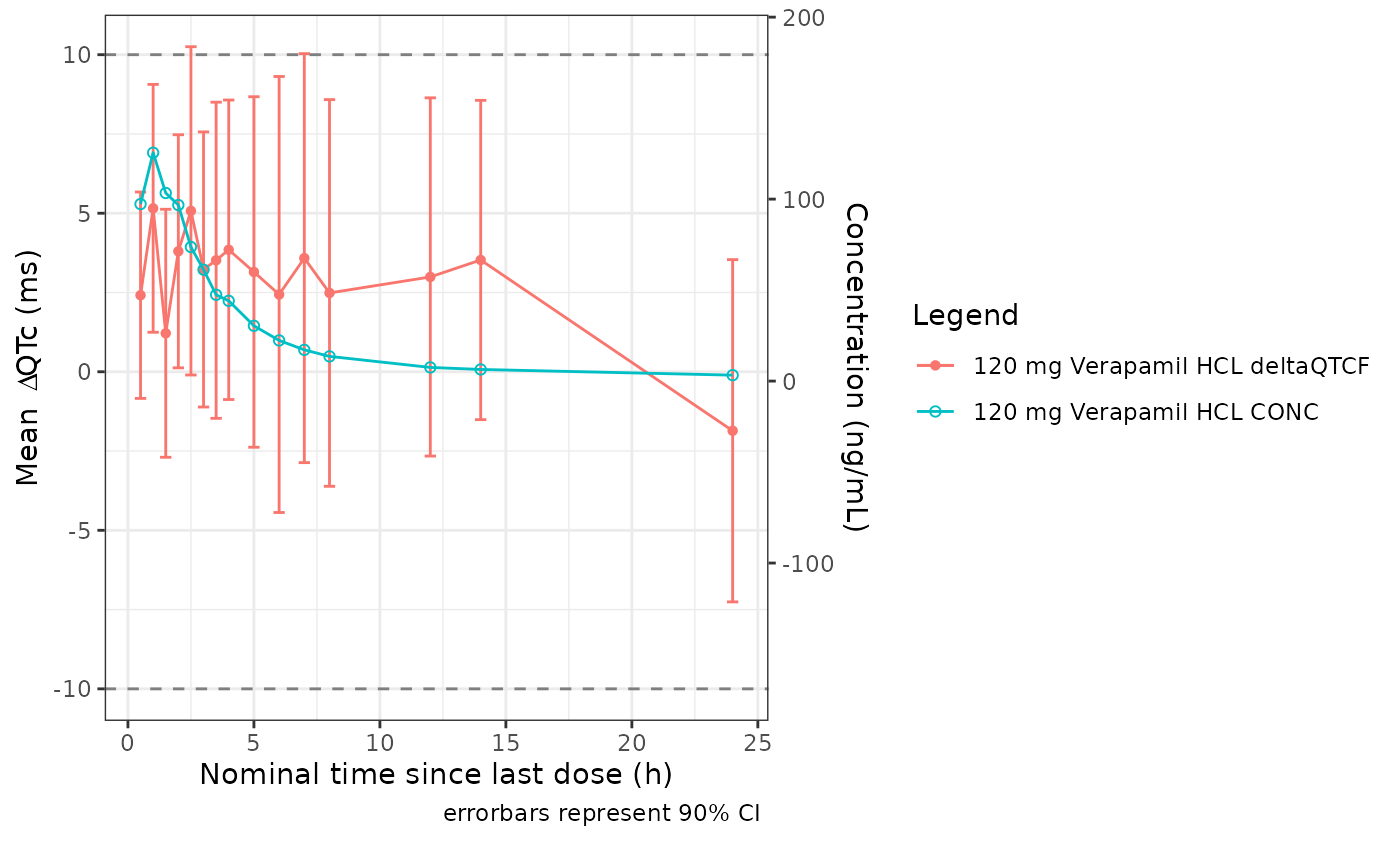
adds horizontal reference lines to plot
add_horizontal_references.Rdadds horizontal reference lines to plot
add_horizontal_references(p, reference_threshold)Value
a ggplot object with refence horizontal lines
Examples
data_proc <- cqtkit_data_verapamil |> preprocess()
eda_mean_dv_over_time(
  data_proc,
  deltaQTCF,
  NTLD,
  DOSEF,
  group_col = TRTG,
  secondary_data_col = CONC,
  reference_dose = "0 mg"
) |>
  add_horizontal_references(
    reference_threshold = c(-10, 10)
  )