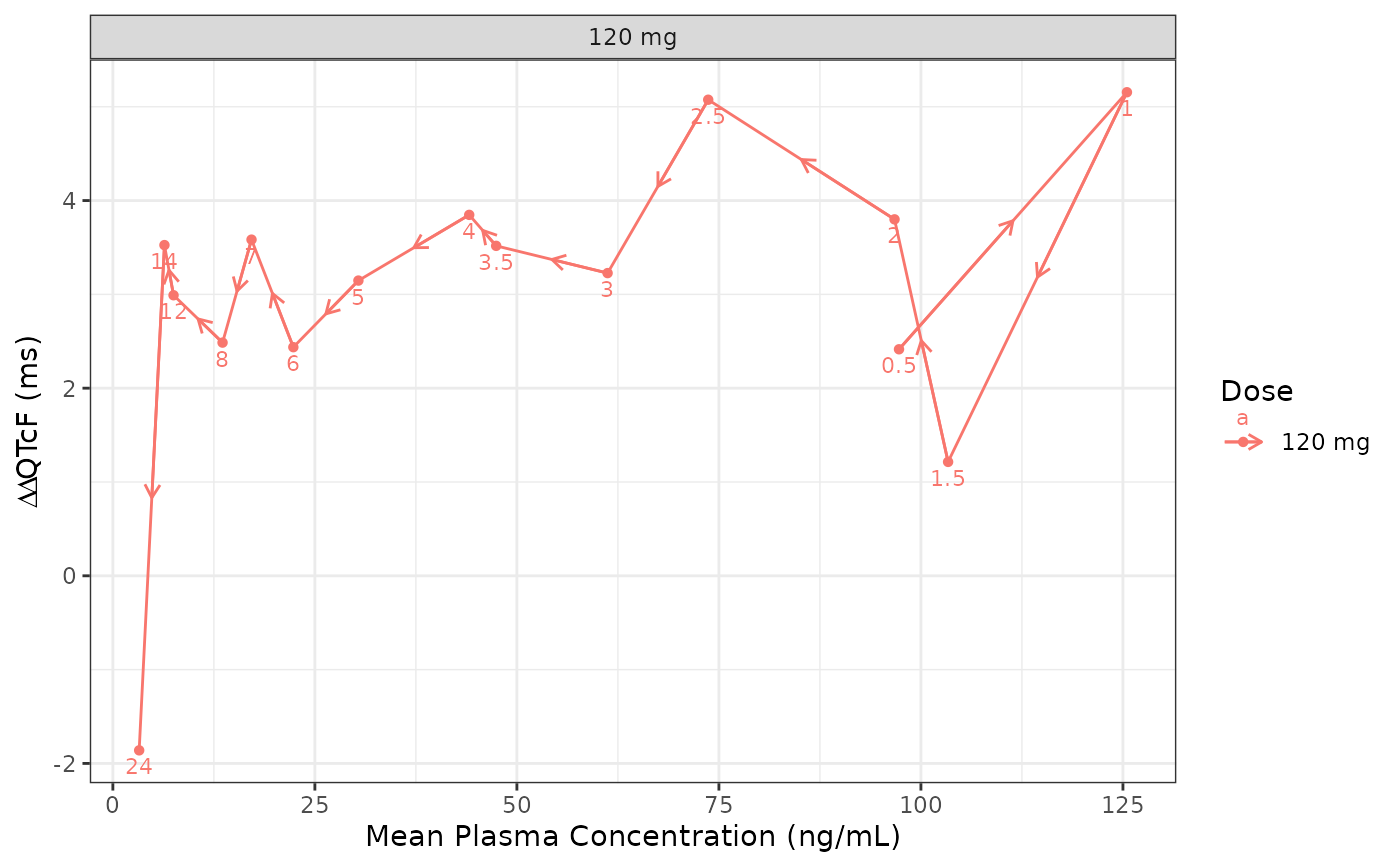
Hysteresis loop plot to visually inspect hysteresis
eda_hysteresis_loop_plot.RdHysteresis loop plot to visually inspect hysteresis
eda_hysteresis_loop_plot(
  data,
  ntime_col,
  deltaqtc_col,
  conc_col,
  dosef_col,
  group_col = NULL,
  reference_dose = NULL,
  show_hysteresis_warning = TRUE,
  style = list()
)
Arguments
- data
A data frame containing C-QT analysis dataset
- ntime_col
An unquoted column name for nominal time points
- deltaqtc_col
An unquoted column name for dQTC measurements at the time points in NTLD
- conc_col
An unquoted column name for drug concentrations at each NTLD
- dosef_col
An unquoted column name for DOSE factors.
- group_col
An unquoted column name for additional grouping column
- reference_dose
Reference dose value for comparison calculations
- show_hysteresis_warning
Boolean, if TRUE adds Hysteresis Detected to facet wrap label for groups with hysteresis detected
- style
A named list of arguments passed to style_plot()
Value
a plot
Examples
data_proc <- preprocess(cqtkit_data_verapamil)

eda_hysteresis_loop_plot(
  data_proc,
  NTLD,
  deltaQTCF,
  CONC,
  DOSEF,
  reference_dose = "0 mg",
  style = set_style(
    ylabel = bquote(Delta~Delta~"QTcF (ms)")
  )
)