Canadian High School Graduate Earnings
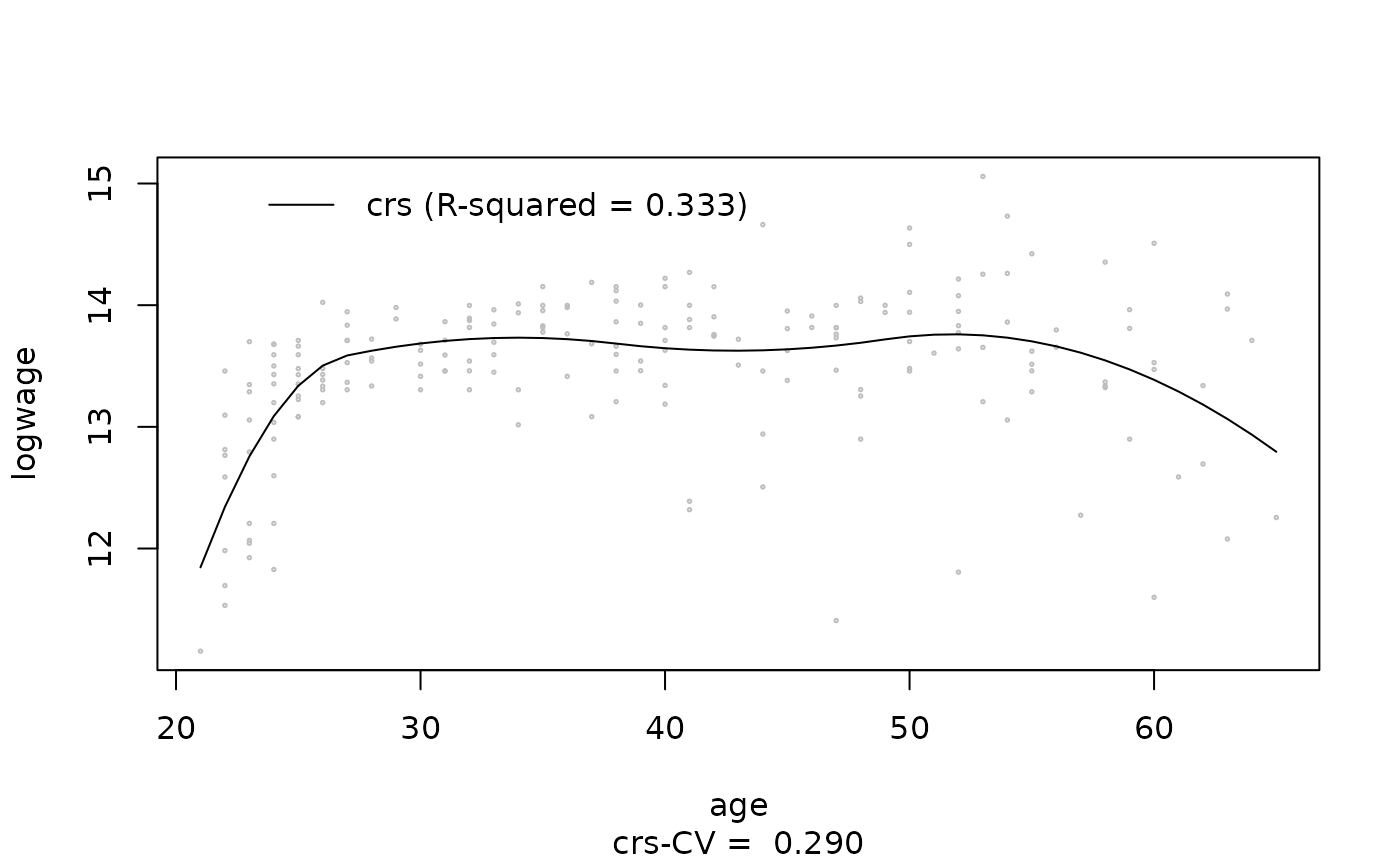
data-cps71.RdCanadian cross-section wage data consisting of a random sample taken from the 1971 Canadian Census Public Use Tapes for male individuals having common education (grade 13). There are 205 observations in total.
Usage
data("cps71")Format
A data frame with 2 columns, and 205 rows.
- logwage
the first column, of type
numeric- age
the second column, of type
integer
Examples
## Example - fit a spline model for log wages as a function of age.
data(cps71, package = "crs")
model.crs <- crs(logwage~age, data = cps71, complexity="degree-knots")
with(cps71, plot(age, logwage, cex=0.25, col="grey",
sub=paste("crs-CV = ", formatC(model.crs$cv.score,format="f",digits=3))))
lines(cps71$age, fitted(model.crs), lty=1, col=1)
crs.txt <- paste("crs (R-squared = ",formatC(model.crs$r.squared,format="f",digits=3),")",sep="")
legend(22.5,15,crs.txt,lty=1,col=1,bty="n")
 summary(model.crs)
#> Call:
#> crs.formula(formula = logwage ~ age, complexity = "degree-knots",
#> data = cps71)
#>
#> Indicator Bases/B-spline Bases Regression Spline
#>
#> There is 1 continuous predictor
#> Spline degree/number of segments for age: 2/4
#> Model complexity proxy: degree-knots
#> Knot type: quantiles
#> Pruning of final model: FALSE
#> Training observations: 205
#> Rank of model frame: 6
#> Trace of smoother matrix: 6
#>
#> Residual standard error: 0.5261 on 199 degrees of freedom
#> Multiple R-squared: 0.3332, Adjusted R-squared: 0.3165
#> F-statistic: 19.89 on 5 and 199 DF, p-value: 4.624e-16
#>
#> Cross-validation score: 0.28981112
#> Search method: exhaustive
#> Estimation time: 0.2 seconds
#>
summary(model.crs)
#> Call:
#> crs.formula(formula = logwage ~ age, complexity = "degree-knots",
#> data = cps71)
#>
#> Indicator Bases/B-spline Bases Regression Spline
#>
#> There is 1 continuous predictor
#> Spline degree/number of segments for age: 2/4
#> Model complexity proxy: degree-knots
#> Knot type: quantiles
#> Pruning of final model: FALSE
#> Training observations: 205
#> Rank of model frame: 6
#> Trace of smoother matrix: 6
#>
#> Residual standard error: 0.5261 on 199 degrees of freedom
#> Multiple R-squared: 0.3332, Adjusted R-squared: 0.3165
#> F-statistic: 19.89 on 5 and 199 DF, p-value: 4.624e-16
#>
#> Cross-validation score: 0.28981112
#> Search method: exhaustive
#> Estimation time: 0.2 seconds
#>