GSL (GNU Scientific Library) B-spline/B-spline Derivatives
gsl-bs.Rdgsl.bs generates the B-spline basis matrix for a
polynomial spline and (optionally) the B-spline basis matrix
derivative of a specified order with respect to each predictor
Usage
gsl.bs(..., display.warnings = TRUE)
# Default S3 method
gsl.bs(x,
       degree = 3,
       nbreak = 2,
       deriv = 0,
       x.min = NULL,
       x.max = NULL,
       intercept = FALSE,
       knots = NULL,
       display.warnings = TRUE,
       ...)
Arguments
Data, Model Inputs And Formula Interface
This argument identifies the predictor variable for spline-basis construction.
Spline Basis Controls
These arguments control spline degree, derivative order, intercept inclusion, knots, and support bounds.
- degree
degree of the piecewise polynomial - default is ‘3’ (cubic spline)
- deriv
the order of the derivative to be computed-default if
0- intercept
if ‘TRUE’, an intercept is included in the basis; default is ‘FALSE’
- knots
a vector (default
knots="NULL") specifying knots for the spline basis (default enables uniform knots, otherwise those provided are used)- nbreak
number of breaks in each interval - default is ‘2’
- x.max
the upper bound on which to construct the spline - defaults to
max(x)- x.min
the lower bound on which to construct the spline - defaults to
min(x)
Details
Typical usages are (see below for a list of options and also the examples at the end of this help file)
Value
gsl.bs returns a gsl.bs object. A matrix of dimension
‘c(length(x), degree+nbreak-1)’. The generic function
predict extracts (or generates) predictions from the
returned object.
A primary use is in modelling formulas to directly specify a piecewise polynomial term in a model. See https://www.gnu.org/software/gsl/ for further details.
References
Li, Q. and J.S. Racine (2007), Nonparametric Econometrics: Theory and Practice, Princeton University Press.
Ma, S. and J.S. Racine and L. Yang (2015), “Spline Regression in the Presence of Categorical Predictors,” Journal of Applied Econometrics, Volume 30, 705-717.
Ma, S. and J.S. Racine (2013), “Additive Regression Splines with Irrelevant Categorical and Continuous Regressors,” Statistica Sinica, Volume 23, 515-541.
Author
Jeffrey S. Racine racinej@mcmaster.ca
Examples
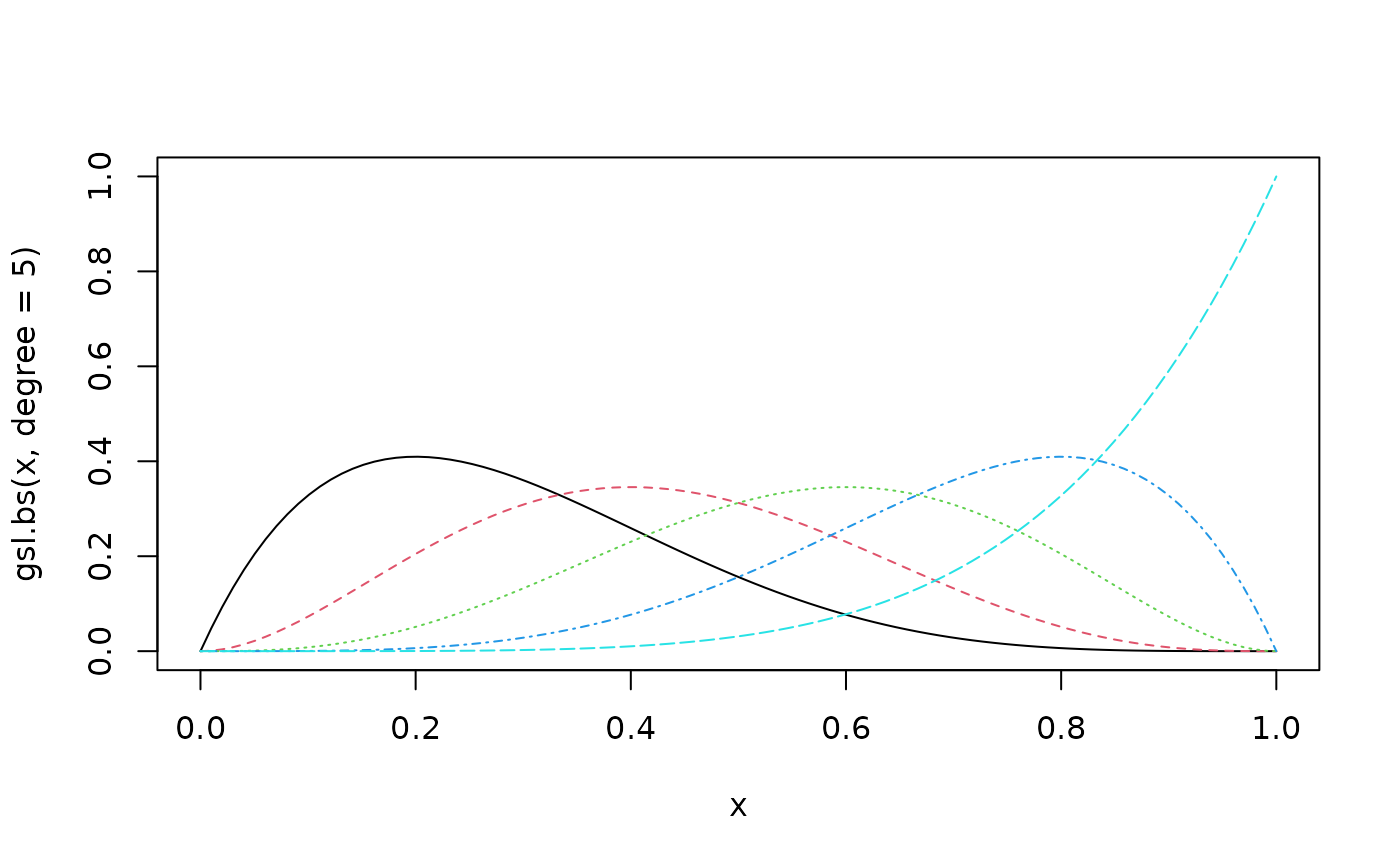
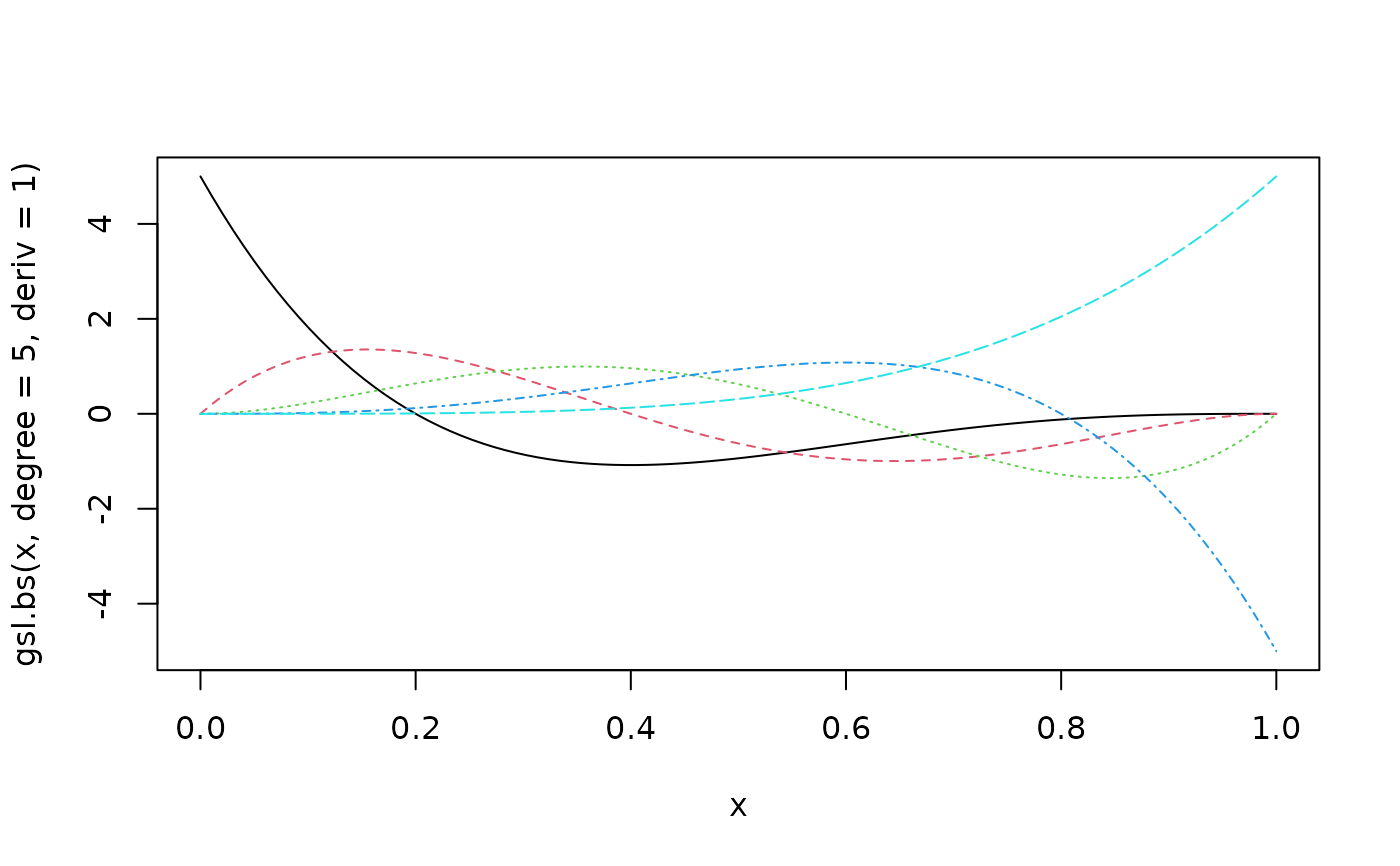
## Plot the spline bases and their first order derivatives
x <- seq(0,1,length=100)
matplot(x,gsl.bs(x,degree=5),type="l")
 matplot(x,gsl.bs(x,degree=5,deriv=1),type="l")
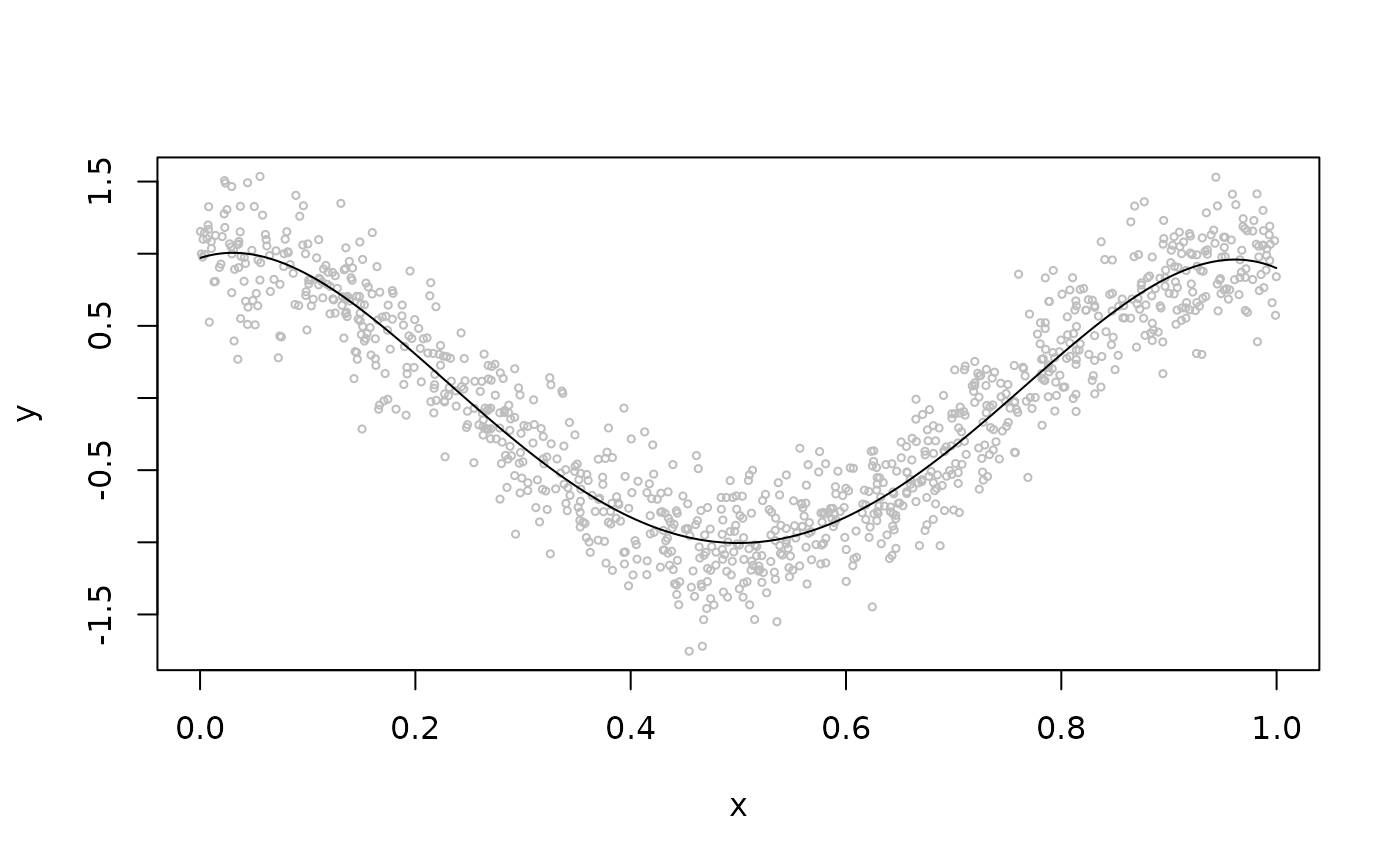
 ## Regression example
n <- 1000
x <- sort(runif(n))
y <- cos(2*pi*x) + rnorm(n,sd=.25)
B <- gsl.bs(x,degree=5,intercept=FALSE)
plot(x,y,cex=.5,col="grey")
lines(x,fitted(lm(y~B)))
## Regression example
n <- 1000
x <- sort(runif(n))
y <- cos(2*pi*x) + rnorm(n,sd=.25)
B <- gsl.bs(x,degree=5,intercept=FALSE)
plot(x,y,cex=.5,col="grey")
lines(x,fitted(lm(y~B)))