Create a bar plot of count (frequency) data that is stored in a data.frame or table.
plotCount(x, ...)Arguments
- x
A data.frame or table. See 'Details' for more information.
- ...
Extra parameters to pass to the barplot. Any parameter that
geom_bar()accepts can be used. For example,fill = "red"can be used fto make the bars red.
Value
A ggplot2 object that can be have more layers added onto it.
Details
The argument to this function is expected to be either a data.frame or a table.
If a data.frame is provided, it must have exactly two columns: the first column contains the unique values in the data, and the second column is the corresponding integer frequencies to each value.
If a table is provided, it must have exactly one row: the rownames are the unique values in the data, and the row values are the corresponding integer frequencies to each value.
Examples
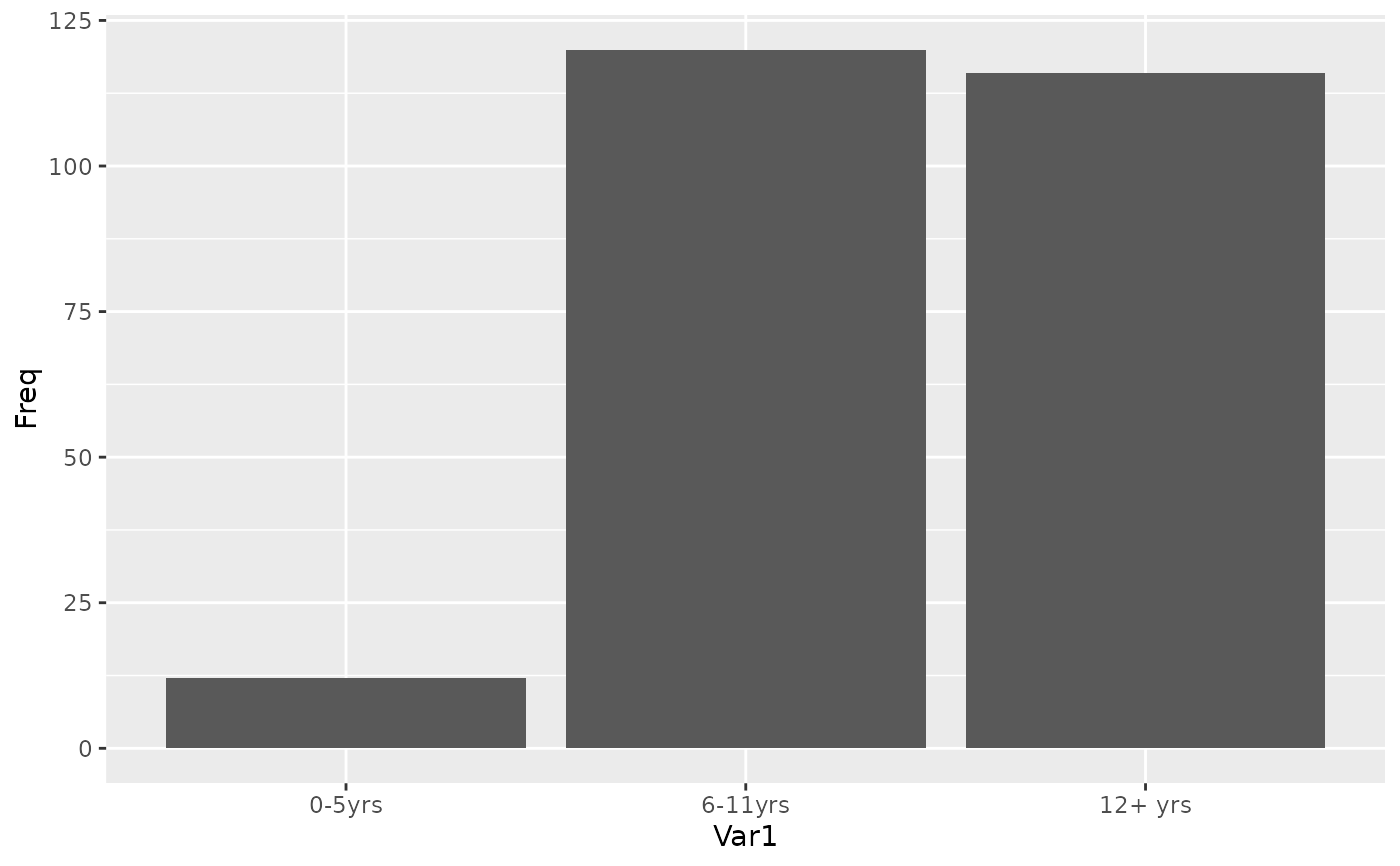
plotCount(table(infert$education))
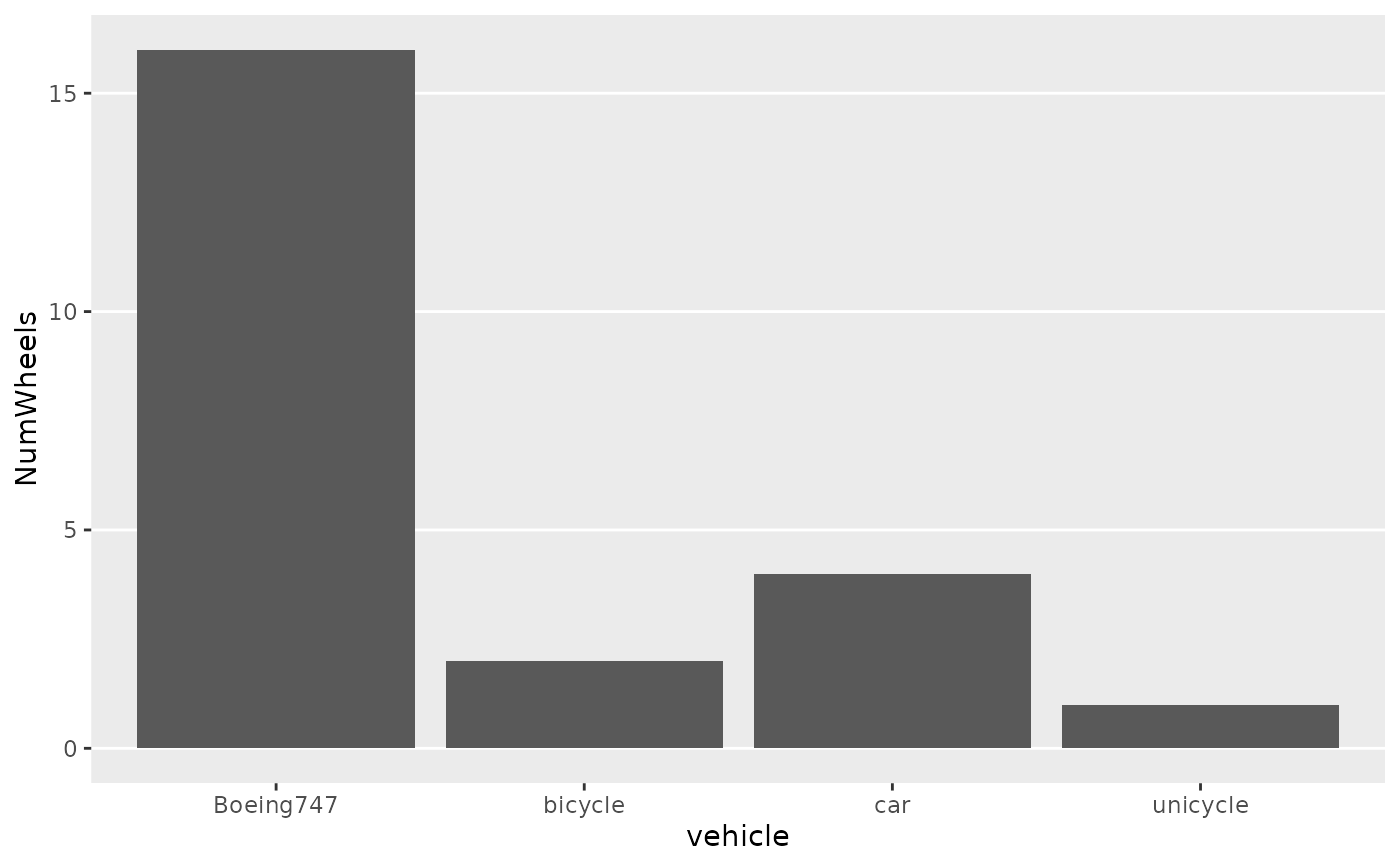
 df <- data.frame("vehicle" = c("bicycle", "car", "unicycle", "Boeing747"),
"NumWheels" = c(2, 4, 1, 16))
plotCount(df) + removeGridX()
df <- data.frame("vehicle" = c("bicycle", "car", "unicycle", "Boeing747"),
"NumWheels" = c(2, 4, 1, 16))
plotCount(df) + removeGridX()