Maps each level to an evenly spaced hue on the colour wheel. It does not generate colour-blind safe palettes.
Arguments
- name
The name of the scale. Used as the axis or legend title. If
waiver(), the default, the name of the scale is taken from the first mapping used for that aesthetic. IfNULL, the legend title will be omitted.- ...
Arguments passed on to
discrete_scalebreaksOne of:
limitsOne of:
NULLto use the default scale valuesA character vector that defines possible values of the scale and their order
A function that accepts the existing (automatic) values and returns new ones. Also accepts rlang lambda function notation.
dropShould unused factor levels be omitted from the scale? The default,
TRUE, uses the levels that appear in the data;FALSEincludes the levels in the factor. Please note that to display every level in a legend, the layer should useshow.legend = TRUE.na.translateUnlike continuous scales, discrete scales can easily show missing values, and do so by default. If you want to remove missing values from a discrete scale, specify
na.translate = FALSE.minor_breaksOne of:
NULLfor no minor breakswaiver()for the default breaks (none for discrete, one minor break between each major break for continuous)A numeric vector of positions
A function that given the limits returns a vector of minor breaks. Also accepts rlang lambda function notation. When the function has two arguments, it will be given the limits and major break positions.
labelsOne of the options below. Please note that when
labelsis a vector, it is highly recommended to also set thebreaksargument as a vector to protect against unintended mismatches.NULLfor no labelswaiver()for the default labels computed by the transformation objectA character vector giving labels (must be same length as
breaks)An expression vector (must be the same length as breaks). See ?plotmath for details.
A function that takes the breaks as input and returns labels as output. Also accepts rlang lambda function notation.
guideA function used to create a guide or its name. See
guides()for more information.callThe
callused to construct the scale for reporting messages.superThe super class to use for the constructed scale
- h
range of hues to use, in [0, 360]
- c
chroma (intensity of colour), maximum value varies depending on combination of hue and luminance.
- l
luminance (lightness), in [0, 100]
- h.start
hue to start at
- direction
direction to travel around the colour wheel, 1 = clockwise, -1 = counter-clockwise
- na.value
Colour to use for missing values
- aesthetics
Character string or vector of character strings listing the name(s) of the aesthetic(s) that this scale works with. This can be useful, for example, to apply colour settings to the
colourandfillaesthetics at the same time, viaaesthetics = c("colour", "fill").
See also
The documentation on colour aesthetics.
The hue and grey scales section of the online ggplot2 book.
Other colour scales:
scale_alpha(),
scale_colour_brewer(),
scale_colour_continuous(),
scale_colour_gradient(),
scale_colour_grey(),
scale_colour_identity(),
scale_colour_manual(),
scale_colour_steps(),
scale_colour_viridis_d()
Examples
# \donttest{
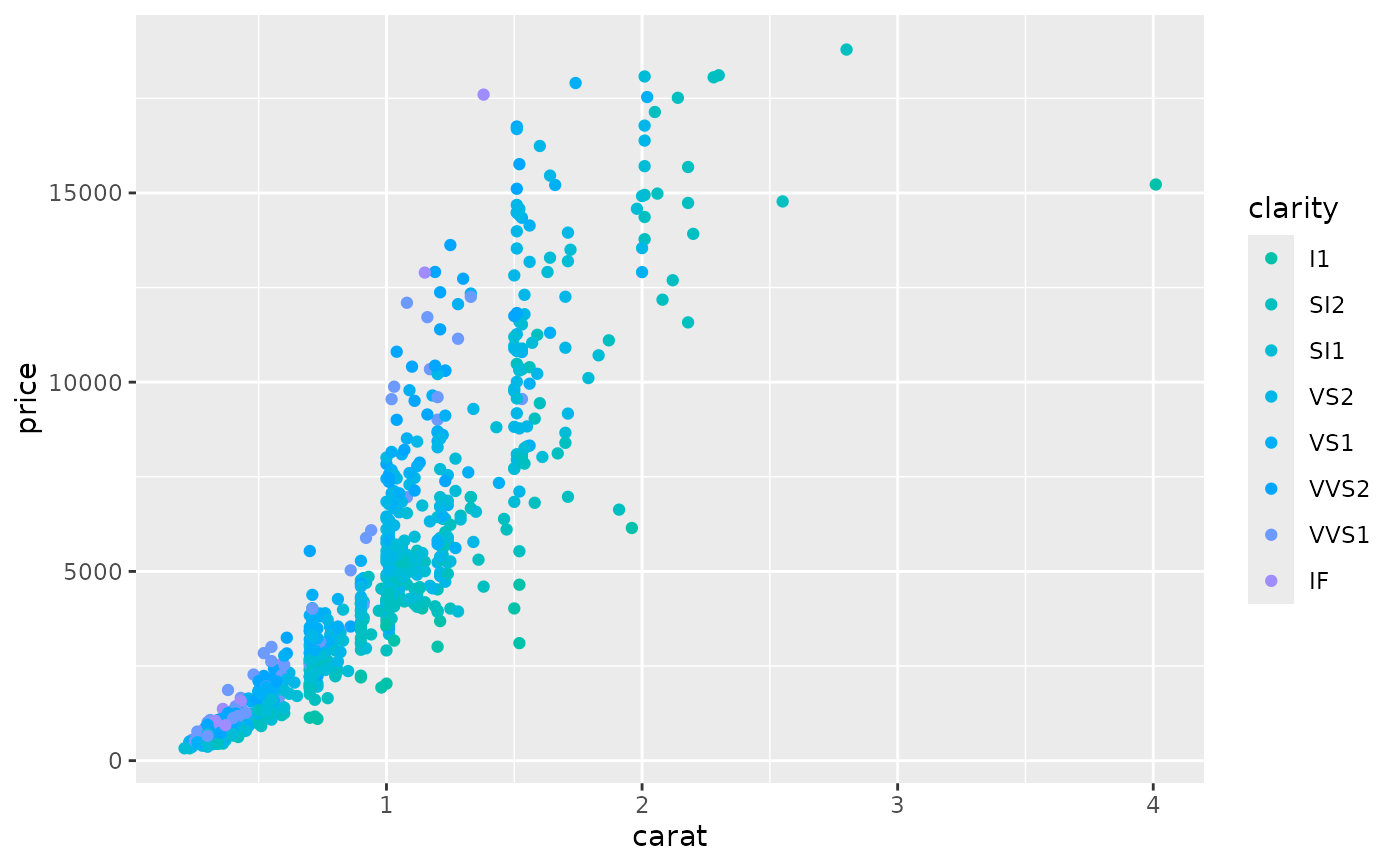
set.seed(596)
dsamp <- diamonds[sample(nrow(diamonds), 1000), ]
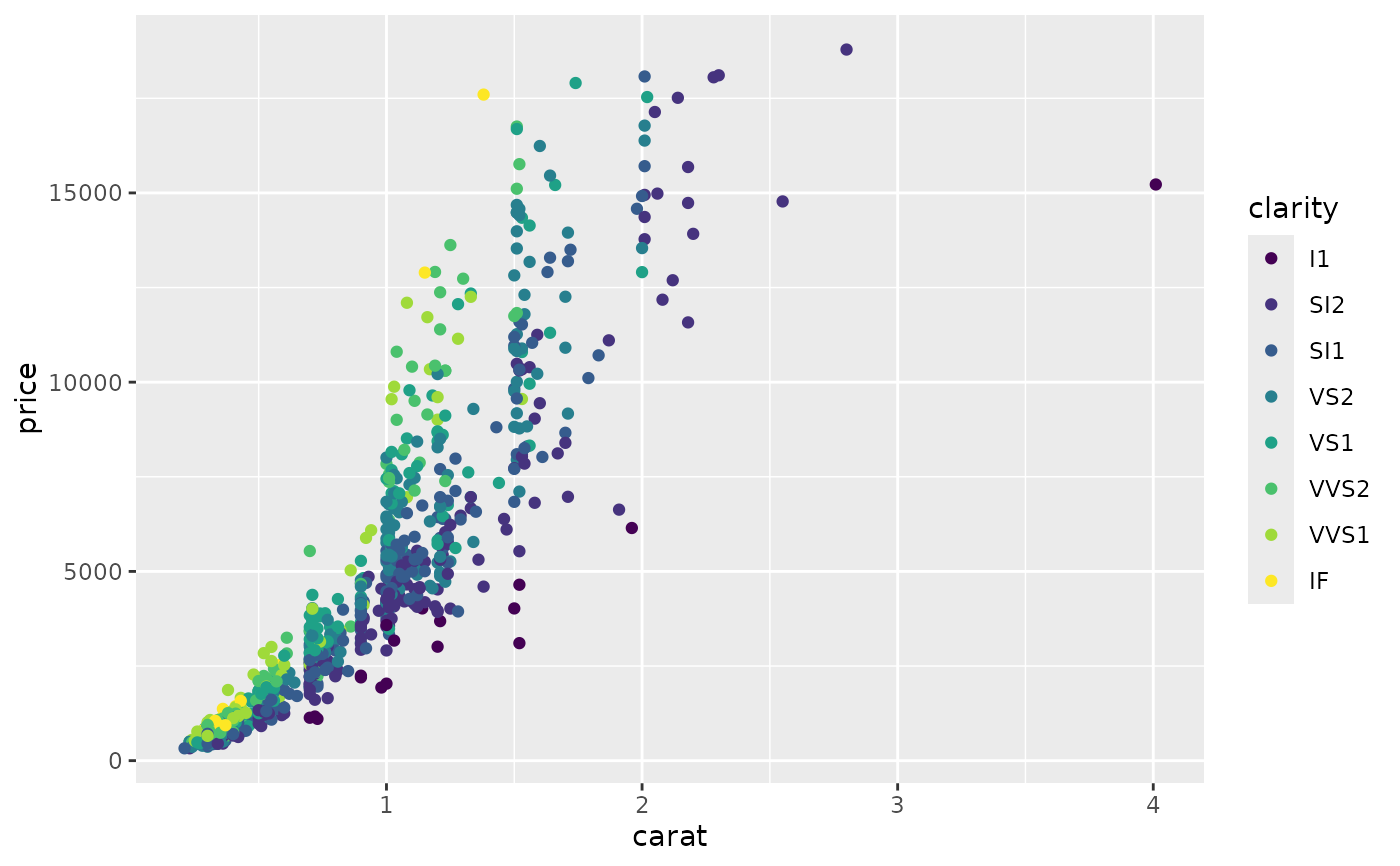
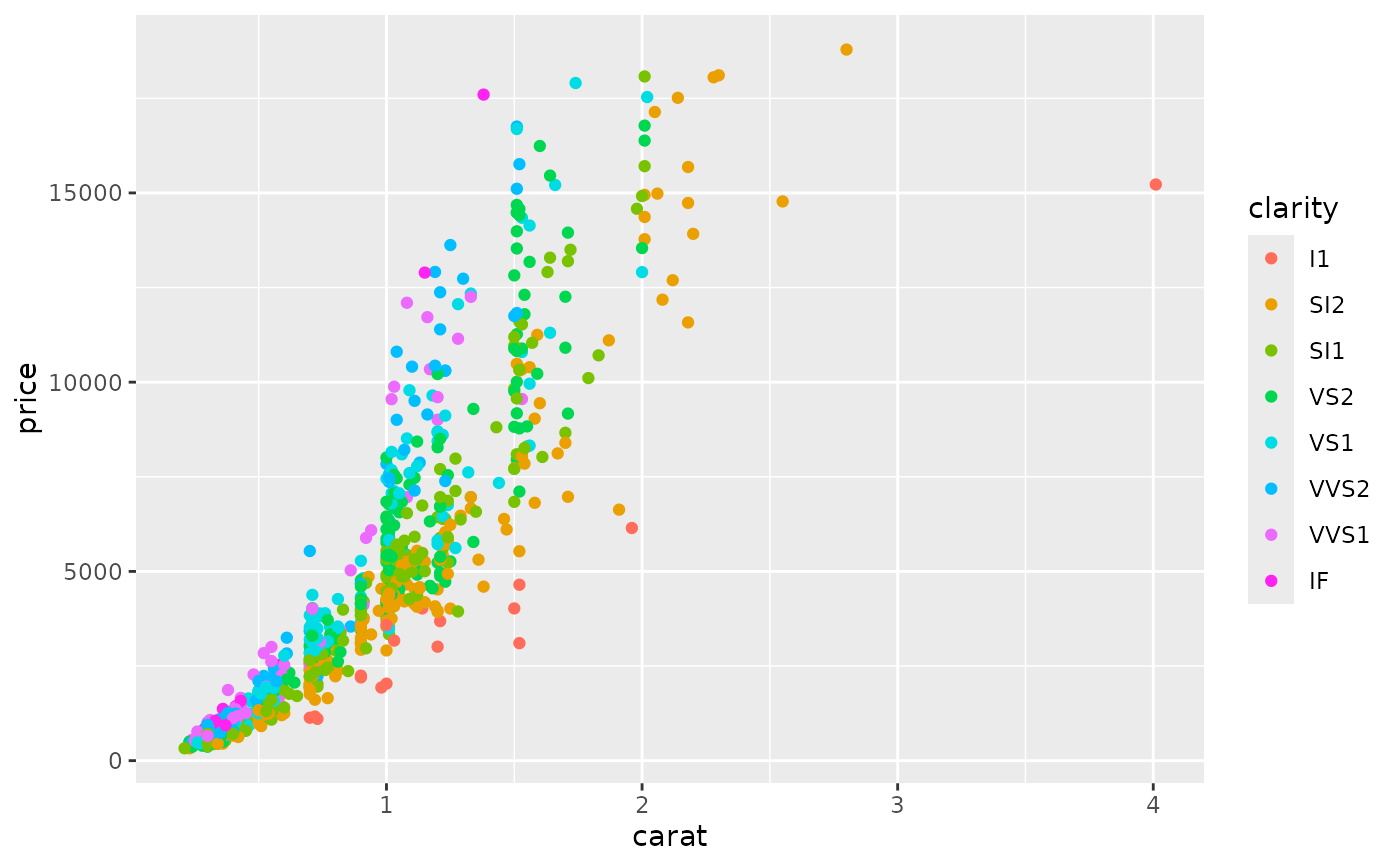
(d <- ggplot(dsamp, aes(carat, price)) + geom_point(aes(colour = clarity)))
 # Change scale label
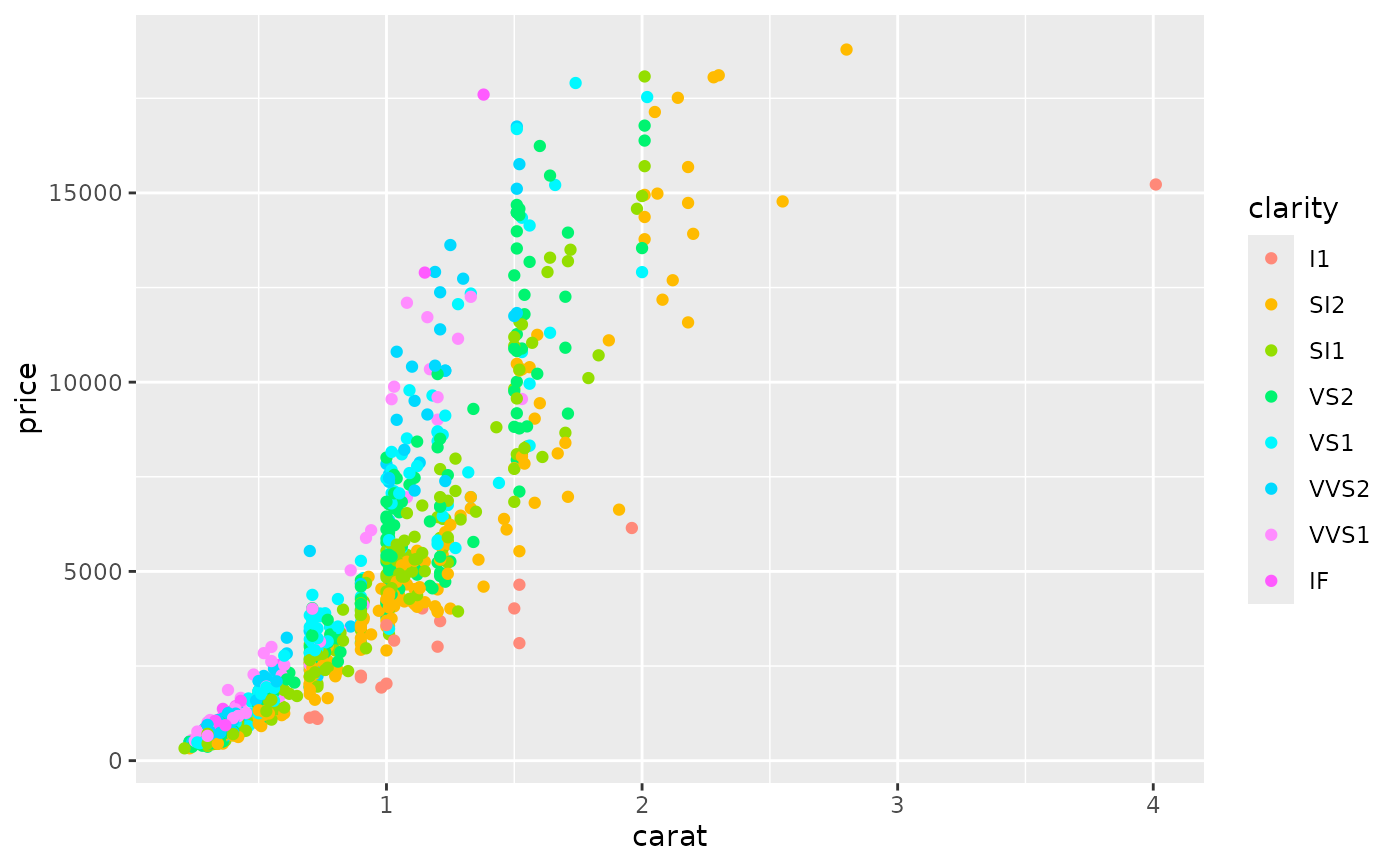
d + scale_colour_hue()
# Change scale label
d + scale_colour_hue()
 d + scale_colour_hue("clarity")
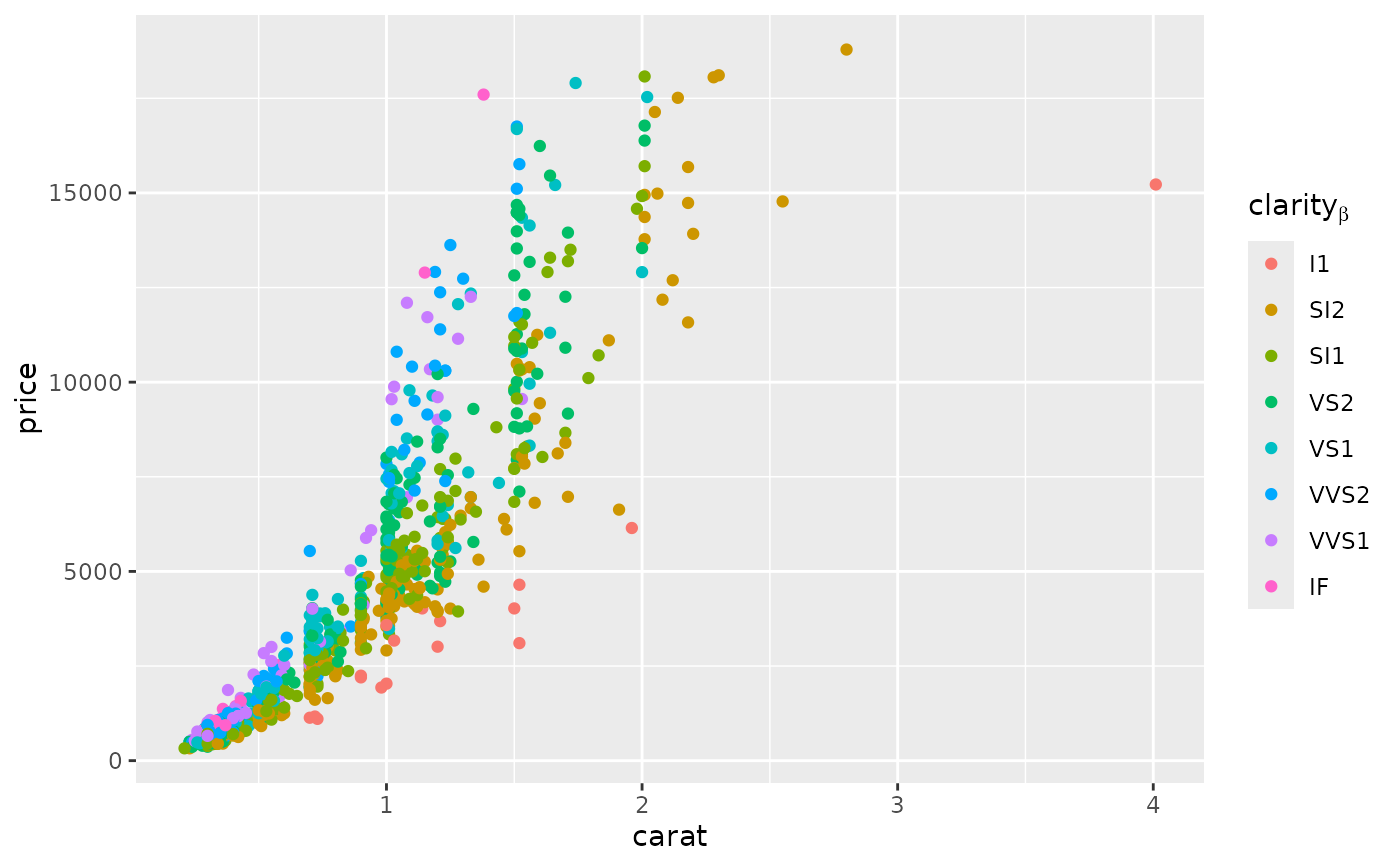
 d + scale_colour_hue(expression(clarity[beta]))
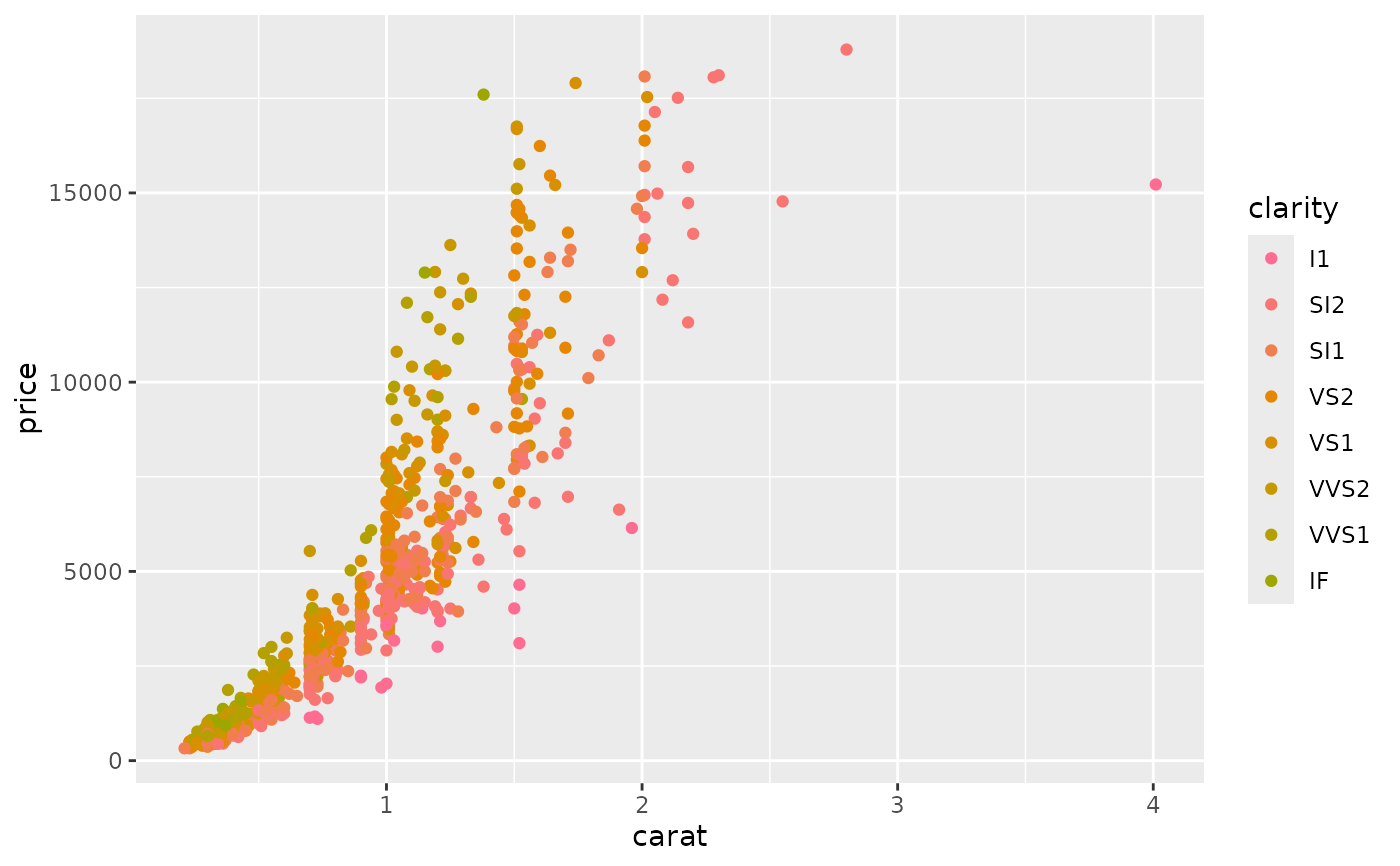
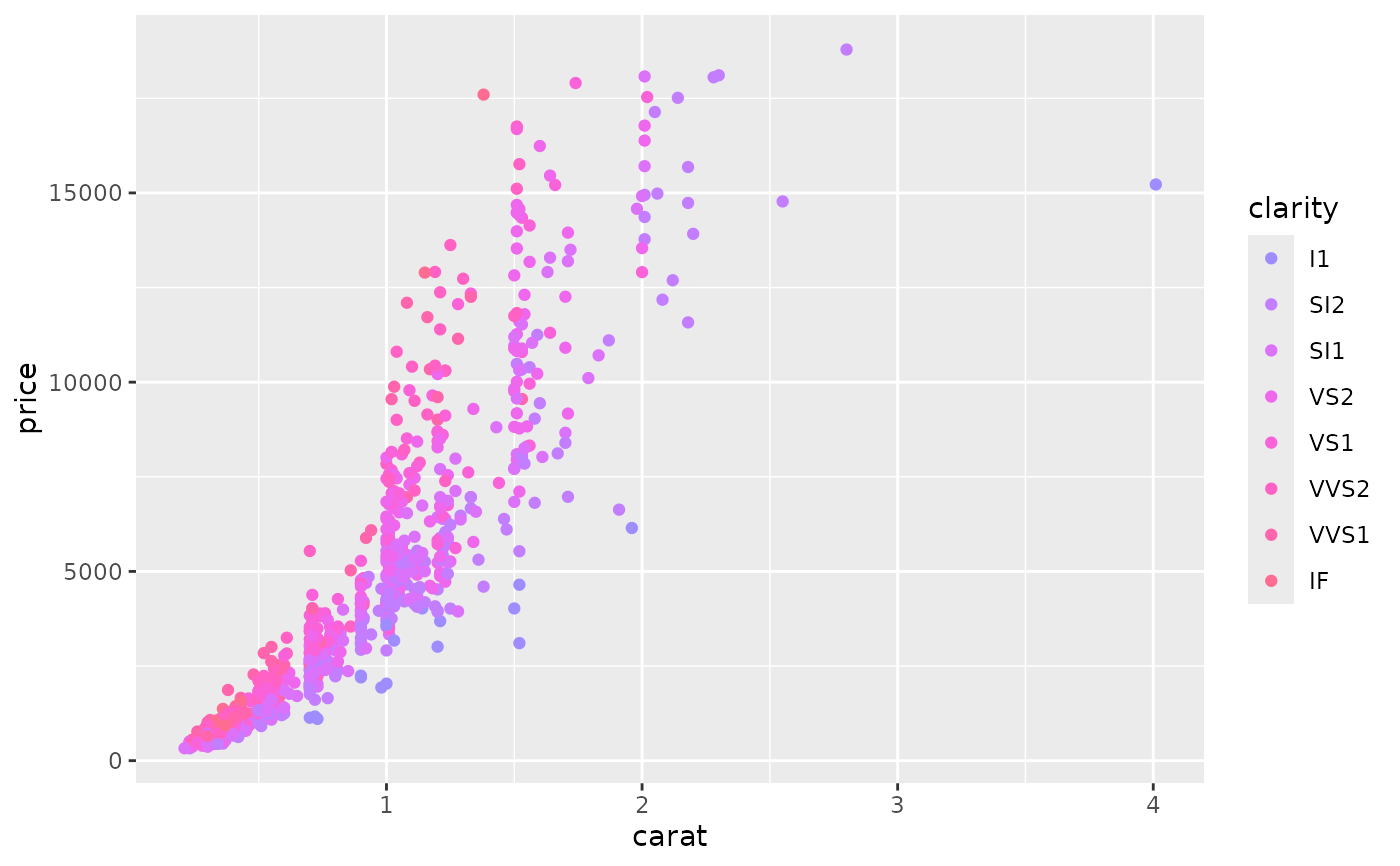
 # Adjust luminosity and chroma
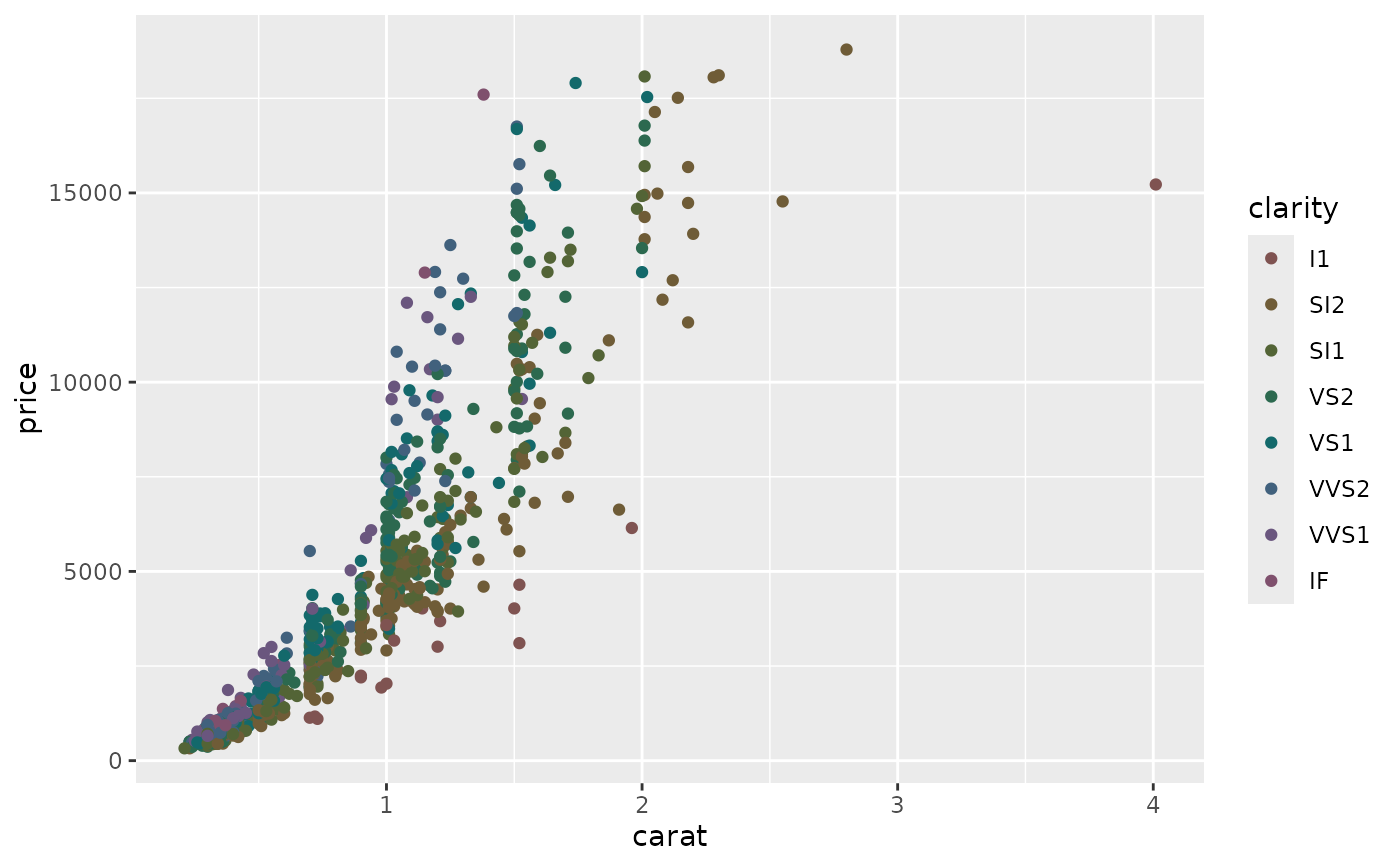
d + scale_colour_hue(l = 40, c = 30)
# Adjust luminosity and chroma
d + scale_colour_hue(l = 40, c = 30)
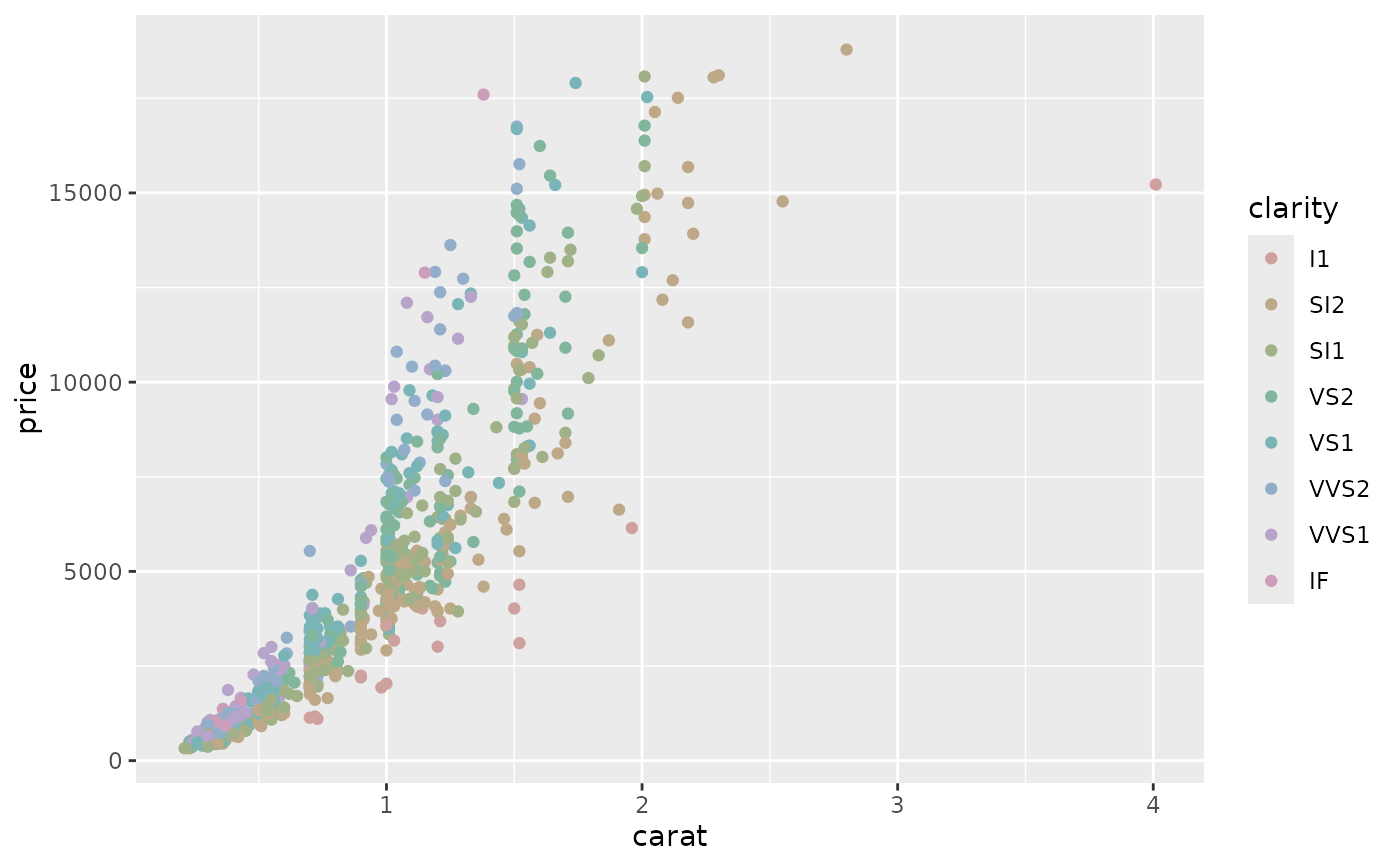
 d + scale_colour_hue(l = 70, c = 30)
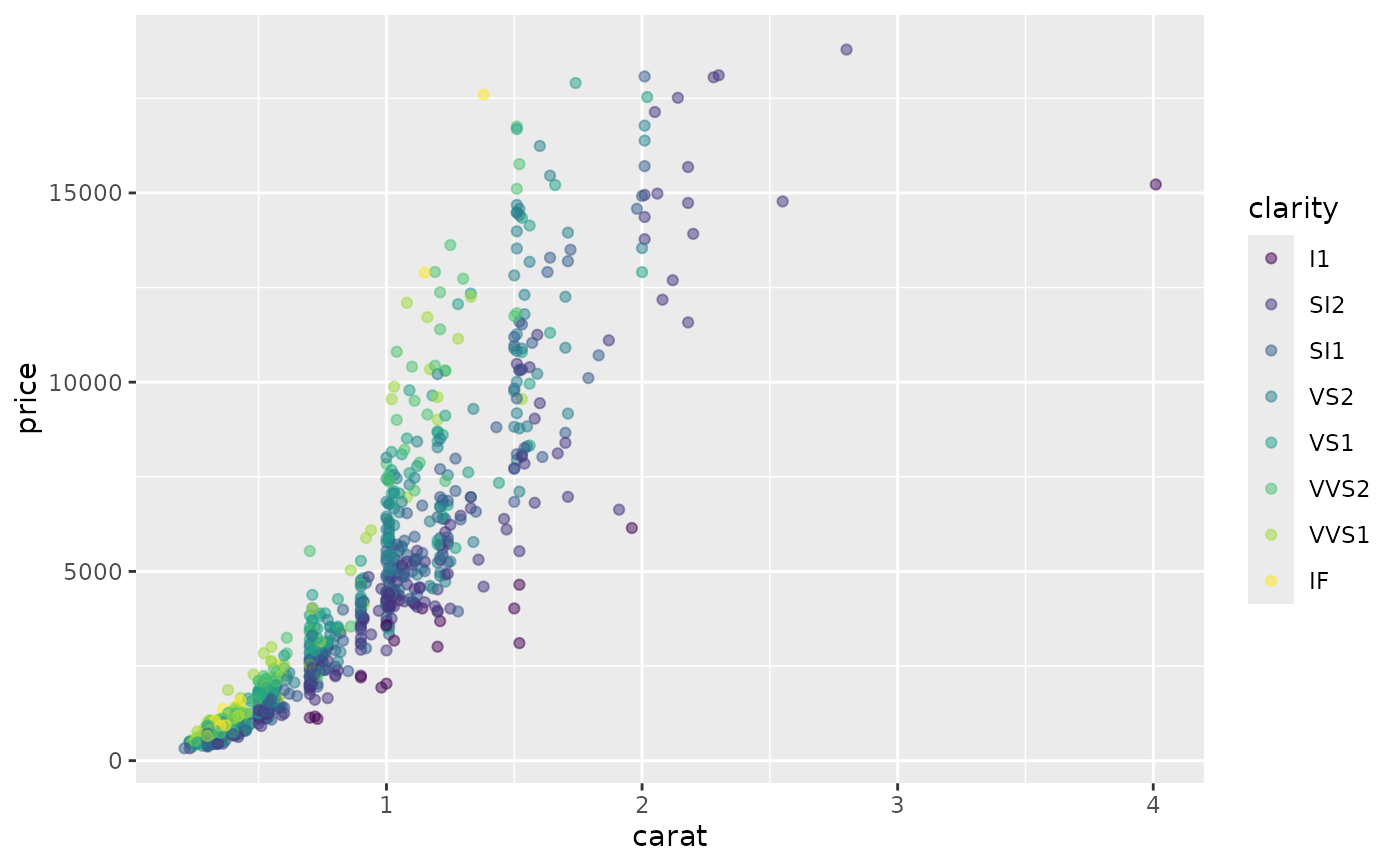
 d + scale_colour_hue(l = 70, c = 150)
 d + scale_colour_hue(l = 80, c = 150)
 # Change range of hues used
d + scale_colour_hue(h = c(0, 90))
# Change range of hues used
d + scale_colour_hue(h = c(0, 90))
 d + scale_colour_hue(h = c(90, 180))
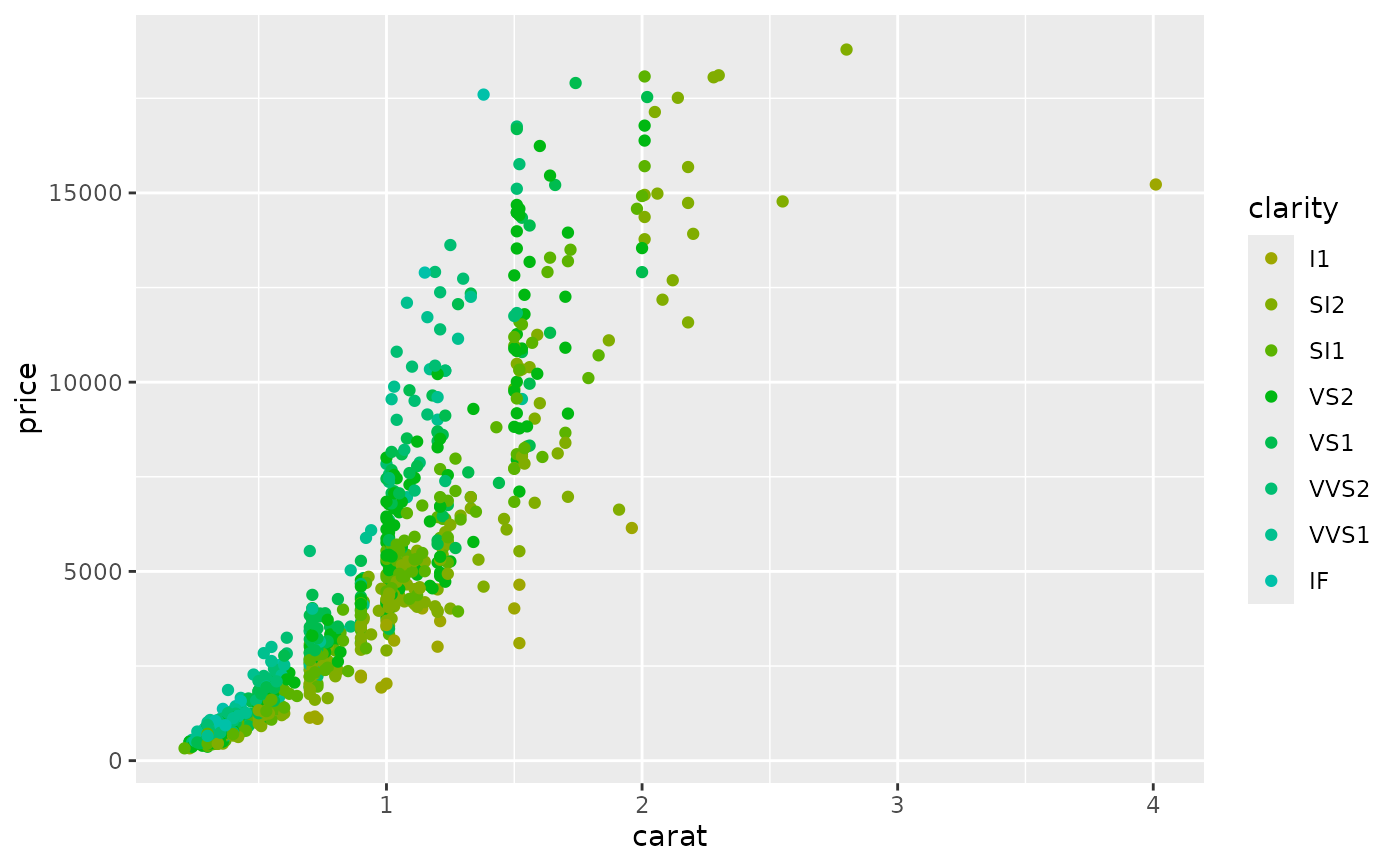 d + scale_colour_hue(h = c(180, 270))
 d + scale_colour_hue(h = c(270, 360))
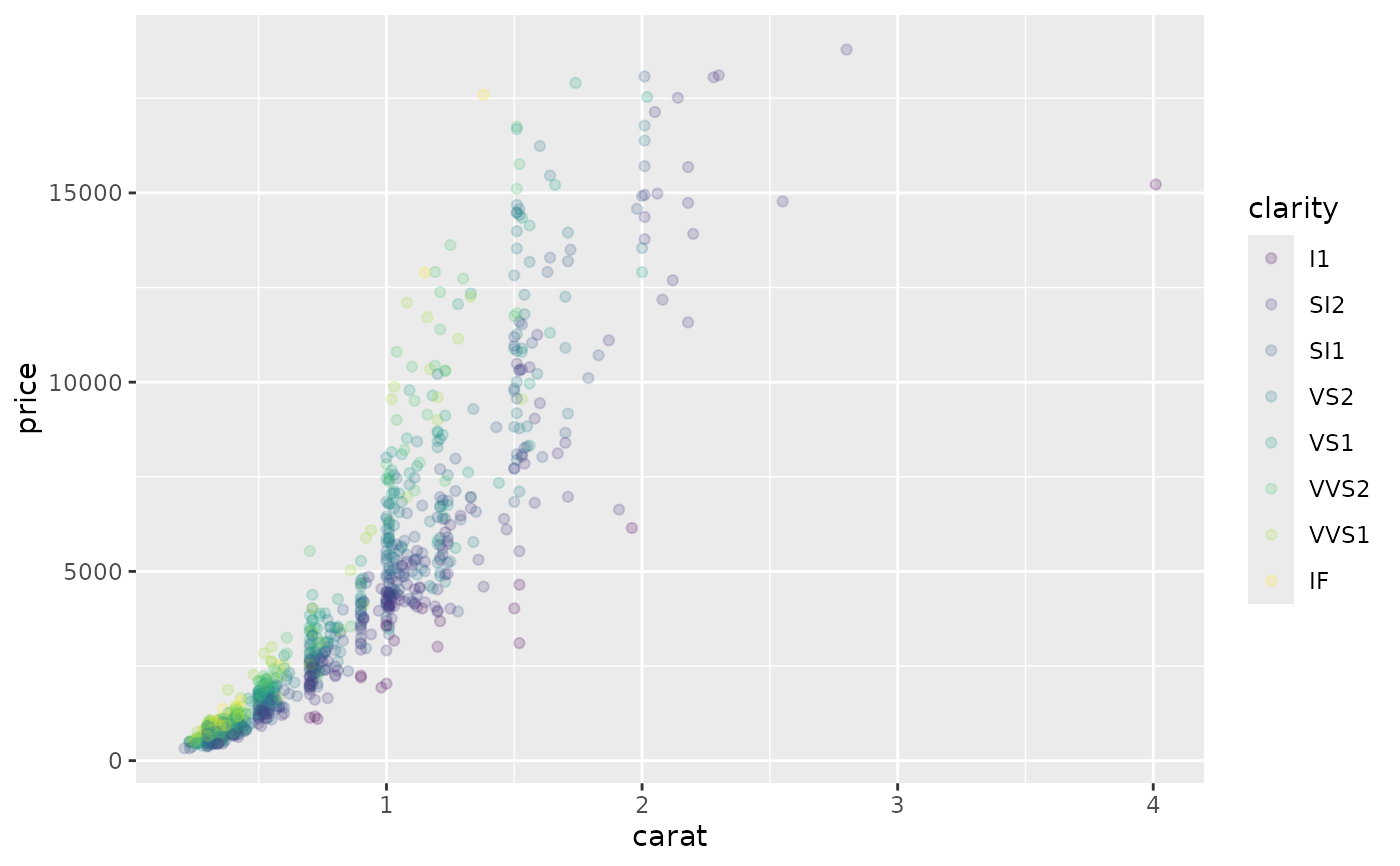
 # Vary opacity
# (only works with pdf, quartz and cairo devices)
d <- ggplot(dsamp, aes(carat, price, colour = clarity))
d + geom_point(alpha = 0.9)
# Vary opacity
# (only works with pdf, quartz and cairo devices)
d <- ggplot(dsamp, aes(carat, price, colour = clarity))
d + geom_point(alpha = 0.9)
 d + geom_point(alpha = 0.5)
 d + geom_point(alpha = 0.2)
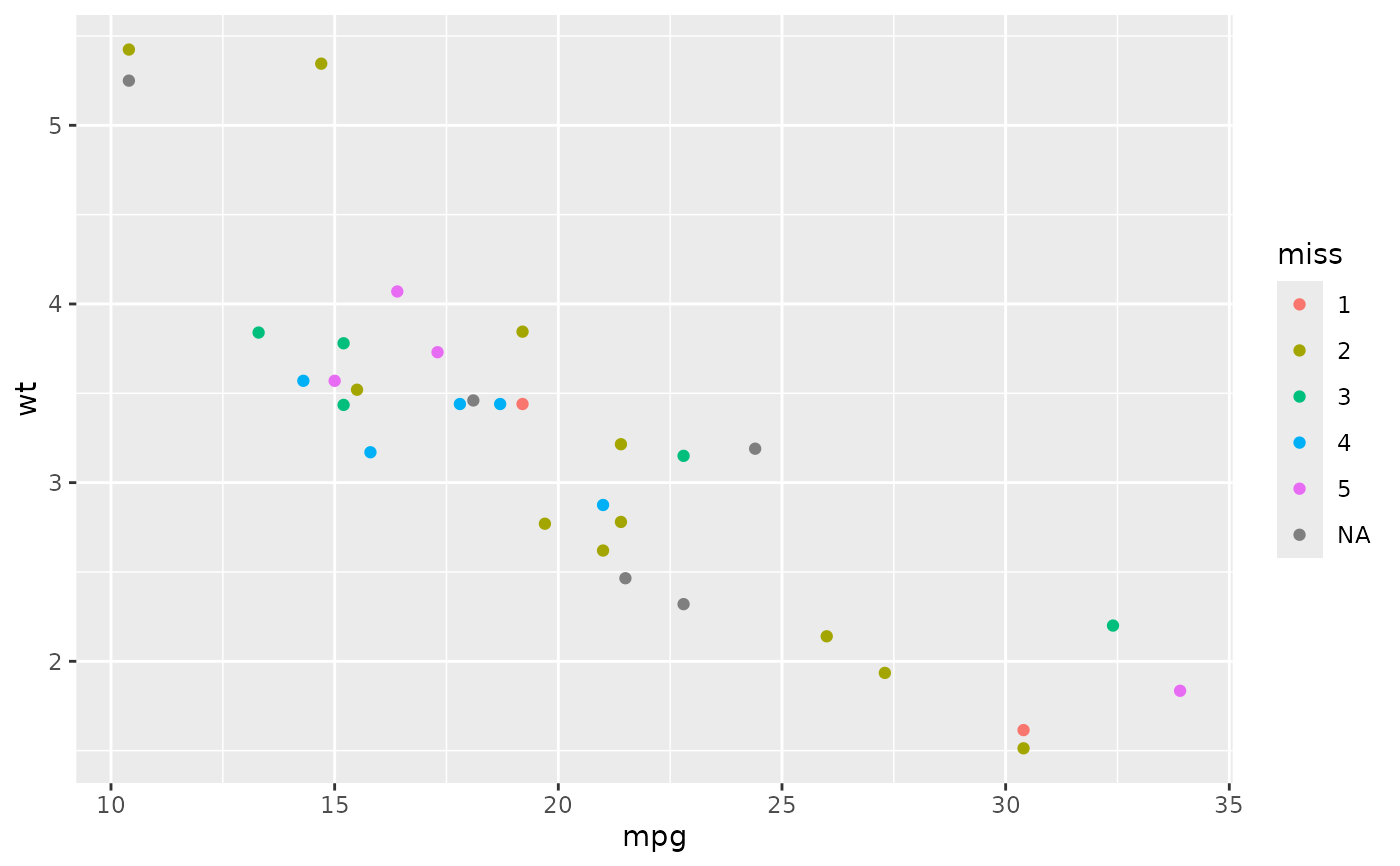
 # Colour of missing values is controlled with na.value:
miss <- factor(sample(c(NA, 1:5), nrow(mtcars), replace = TRUE))
ggplot(mtcars, aes(mpg, wt)) +
geom_point(aes(colour = miss))
# Colour of missing values is controlled with na.value:
miss <- factor(sample(c(NA, 1:5), nrow(mtcars), replace = TRUE))
ggplot(mtcars, aes(mpg, wt)) +
geom_point(aes(colour = miss))
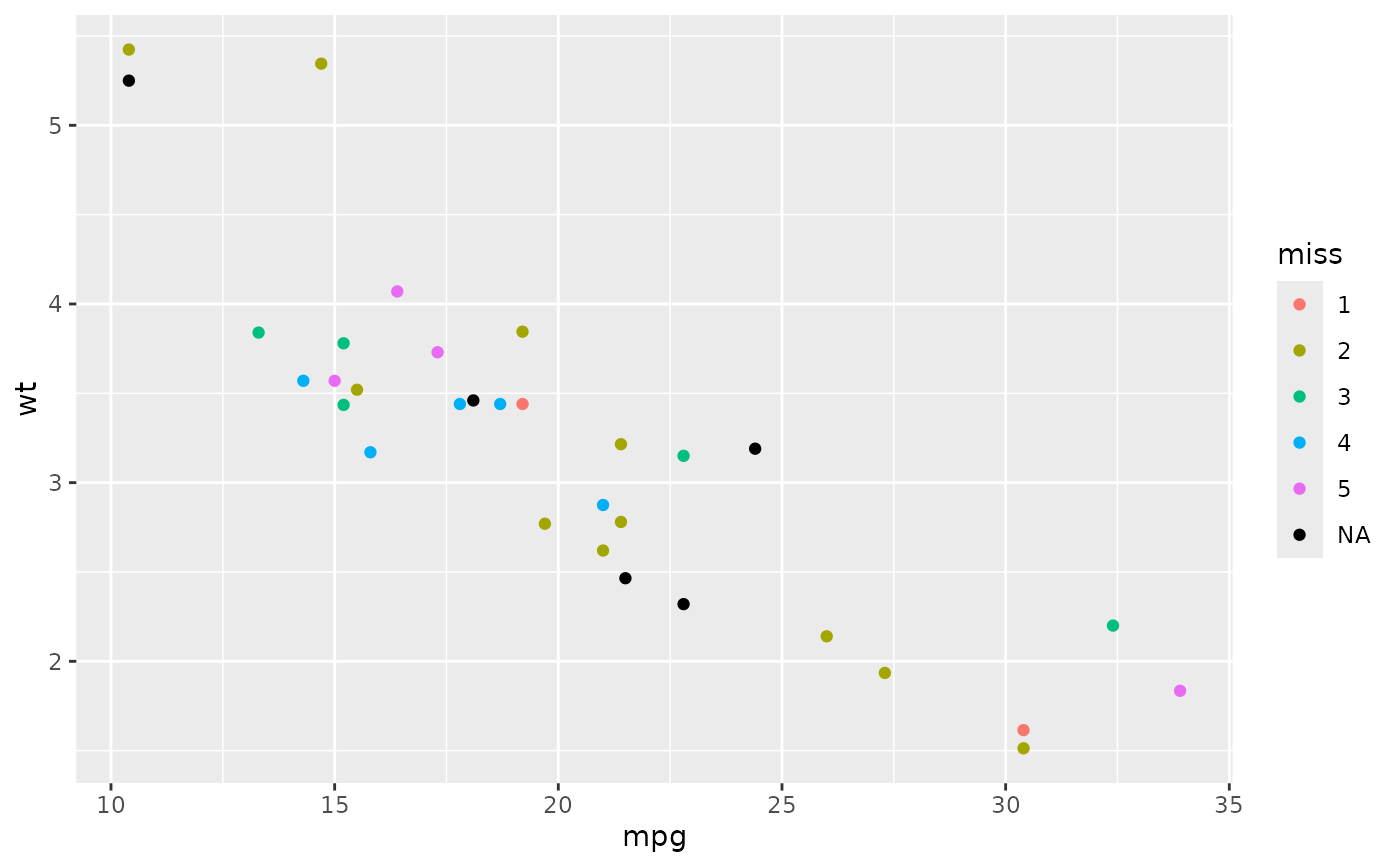
 ggplot(mtcars, aes(mpg, wt)) +
geom_point(aes(colour = miss)) +
scale_colour_hue(na.value = "black")
ggplot(mtcars, aes(mpg, wt)) +
geom_point(aes(colour = miss)) +
scale_colour_hue(na.value = "black")
 # }
# }