Using LaTeX for annotations
‘ggpmisc’ 1.0.0
Pedro J. Aphalo
2026-07-17
Source:vignettes/articles/latex-labels.Rmd
latex-labels.RmdAims of ‘ggpmisc’ and caveats
Package ‘ggpmisc’ makes it easier to add to plots created using ‘ggplot2’ annotations based on fitted models and other statistics. It does this by wrapping existing model fit and other functions. The same annotations can be produced by calling the model fit functions, extracting the desired estimates and adding them to plots. There are two advantages in wrapping these functions in an extension to package ‘ggplot2’: 1) we ensure the coupling of graphical elements and the annotations by building all elements of the plot using the same data and a consistent grammar and 2) we make it easier to annotate plots to the casual user of R, already familiar with the grammar of graphics.
To avoid confusion it is good to make clear what may seem obvious to some: if no plot is needed, then there is no reason to use this package. The values shown as annotations are not computed by ‘ggpmisc’ but instead by the usual model-fit and statistical functions from R and R packages. The same is true for model predictions, residuals, etc. that some of the functions in ‘ggpmisc’ display as lines, segments, or other graphical elements.
It is also important to remember that in most cases data analysis including exploratory and other stages should take place before annotated plots for publication are produced. Even though data analysis can benefit from combined numerical and graphical representation of the results, the use I envision for ‘ggpmisc’ is mainly for the production of plots for publication or communication. In case case, whether used for analysis or communication, it is crucial that users cite and refer both to ‘ggpmisc’ and to the underlying R and R packages when publishing plots created with functions and methods from ‘ggpmisc’.
Using $\LaTeX$
R package ‘xdvir’ opens the door to easily using $\LaTeX$ to typeset labels and other text annotations and to convert the DVI device independent output into R’s ‘grid’ graphical commands. This provides a big step forward in the quality of typesetting of mathematical expressions compared to R’s plotmath expressions or markdown.
Package ‘ggpmisc’ has supported $\LaTeX$ formatting of labels but it has been
in the past complex to combine them with ggplots. Package ‘xdvir’
provides geom_latex() that makes using the $\LaTeX$-formatted labels from ‘ggpmisc’
extremely easy.
Package ‘xdvir’ was created by Paul Murrell, the person behind most of the improvements to R’s graphics “engine” of the past two or three decades. Murrell (2025) describes ‘xdvir’ in detail, and I recommend reading this article. For other aspects of R graphics, see Murrel’s book ().
print(citation(package = "xdvir", auto = TRUE), bibtex = FALSE)
#> To cite package 'xdvir' in publications use:
#>
#>   Murrell P (2026). _xdvir: Render 'LaTeX' in Plots_. R package version
#>   0.2-0,
#>   <https://stattech.wordpress.fos.auckland.ac.nz/2025/03/06/2025-01-latex-typesetting-in-r/>.
At the moment only some R graphic devices support the newer features of ‘grid’ graphics. The plots in this document have been rendered by ‘svglite’. A reasonably recent version of R is also needed.
Package ‘xdvir’ depends on R (>= 4.3.0) and has as system
requirement ‘freetype2’. In package ‘ggpmisc’ (< 0.6.0) the
generation of labels with $\LaTeX$
markup had some bugs; ‘ggpmisc’ (>= 0.6.0) is better tested and also
easier to use with geom_latex() from package ‘xdvir’. The
geoms from ‘ggpp’ obey the geom element of themes from ‘ggplot2’ (>=
4.0.0).
Advantages and disadvantages
R plotmath expressions can be used to display mathematical equations in ‘ggplots’ but the typesetting is not as refined as with $\LaTeX$. Plotmath supports changes between upright, italic and bold, but not changes in colour or font family. Most limiting in some cases in that labels can have a single line.
Markdown makes possible to some extent multiline text, use multiple colours and fonts in a single label and also line breaks. However, maths typesetting is lacking.
$\LaTeX$ does not have any of these limitations, but using it for individually typeset labels is more time consuming. This is not as bad as is could be because labels are cached and rendered only when they are modified.
Murrel (2025) describes this in detail in an article. The examples below show how much better the output is and some of the new possibilities.
Examples
Preliminaries
There are two different pieces of software under the name TinyTeX.
One is a distribution of $\TeX$ and
relatives, including executables and a collection $\LaTeX$ packages. This is totally
independent of R. There is also an R package ‘tinytex’ that makes it
possible to compile from within R .tex documents, possibly
generated and saved on-the-fly by R.
To use the R package ‘tinytex’ an installation of $\TeX$ and relatives must be available. The author of ‘tinytex’ has created the TinyTeX distribution as a simple approach to using $\TeX$ and $\LaTeX$. The ‘tinytex’ package can also use other distributions. If you already have MikTeX or TeX Live installed, it is best NOT to install TinyTeX unless you are willing to first uninstall them.
Before installing the TinyTeX distribution, do check the TinyTeX documentation.
Package ‘xdvir’ depends on ‘tinytex’ and ‘grid’. The default $\TeX$ engine is ‘luatex’, but as it is not yet fully supported, it is currentöy safer to use ‘xetex’ instead.
## Math typesetting by LuaTeX can fall back into mode=base
## (which we can't currently handle)
## so use XeTeX engine for this vignette
options(xdvir.engine = "xetex")We will also farther down compare $\LaTeX$ and Markdown markup, with ‘ggtext’.
For debugging, longer messages can be very helpful.
Attaching package ‘ggpmisc’ also attaches package ‘ggpp’ as it provides several of the geometries used by default in the statistics described below. Package ‘ggpp’ can be loaded and attached on its own, and has separate documentation.
This file was rendered using ‘ggplot2’ (== 4.0.3), ‘ggpmisc’ (== 1.0.0), ‘ggpp’ (== 0.6.1), ‘ggtext’ (== 0.1.2), ‘xdvir’ (== 0.2.0), ‘tinytex’ (== 0.60), ‘grid’ (== 4.6.1), and ‘ragg’ (== 1.5.2).
As we will use text and labels on the plotting area we change the default theme to an uncluttered one. We also change titles to be treated as $\LaTeX$ encoded.
theme_set(theme_classic() +
  theme(axis.title.y = element_latex(),
        axis.title.x = element_latex(),
        axis.text.y =  element_latex(),
        axis.text.x =  element_latex(),
        plot.title = element_latex(packages="xcolor"),
        plot.subtitle = element_latex(packages="xcolor")))
stat_correlation()
We first generate a set of artificial data suitable for the plotting examples in this and subsequent sections.
set.seed(4321)
x <- (1:100) / 10
y <- x + rnorm(length(x))
my.data <- data.frame(x = x,
                      y = y,
                      y.desc = - y,
                      group = c("A", "B"))
We start by checking that ‘xdvir’ is working as expected. One thing
to keep in mind is the need to escape especial characters, here using
\\ instead of \. This is necessary as the
backslash has a especial “meaning” in R’s character strings.
ggplot(my.data, aes(x, y)) +
  geom_point() +
  annotate(geom = "latex",
           label = "\\textbf{abc} $\\sqrt[2]{10}$", x = 1, y = 9) +
  labs(title = "Use of \\LaTeX\\ can be \\textcolor{red}{colourful}!",
       subtitle =
         paste("Math like $\\sqrt[3]{12}$ as well as \\emph{italic} and",
               "\\strong{bold} become available."),
       y = "$y = x + N(1, 1)$", x = "$x$")
#> tlmgr search --file --global '/standalone.cls'
#> Trying to automatically install missing LaTeX packages...
#> tlmgr install standalone
#> tlmgr search --file --global '/luatex85.sty'
#> Trying to automatically install missing LaTeX packages...
#> tlmgr install luatex85
#> tlmgr search --file --global '/varwidth.sty'
#> Trying to automatically install missing LaTeX packages...
#> tlmgr install varwidth
#> tlmgr search --file --global '/preview.sty'
#> Trying to automatically install missing LaTeX packages...
#> tlmgr install preview
#> I was unable to find any missing LaTeX packages from the error log /tmp/Rtmp2hUviG/file3e5ad06557a.log.
#> I was unable to find any missing LaTeX packages from the error log /tmp/Rtmp2hUviG/file3e5ad06557a.log.
#> I was unable to find any missing LaTeX packages from the error log /tmp/Rtmp2hUviG/file3e5a64407a7.log.
#> I was unable to find any missing LaTeX packages from the error log /tmp/Rtmp2hUviG/file3e5a64407a7.log.
#> I was unable to find any missing LaTeX packages from the error log /tmp/Rtmp2hUviG/file3e5a5191fd7f.log.
#> I was unable to find any missing LaTeX packages from the error log /tmp/Rtmp2hUviG/file3e5a5191fd7f.log.
#> I was unable to find any missing LaTeX packages from the error log /tmp/Rtmp2hUviG/file3e5a71c1e993.log.
#> I was unable to find any missing LaTeX packages from the error log /tmp/Rtmp2hUviG/file3e5a71c1e993.log.
#> I was unable to find any missing LaTeX packages from the error log /tmp/Rtmp2hUviG/file3e5a17b62c04.log.
#> I was unable to find any missing LaTeX packages from the error log /tmp/Rtmp2hUviG/file3e5a17b62c04.log.
#> I was unable to find any missing LaTeX packages from the error log /tmp/Rtmp2hUviG/file3e5acbc2bbc.log.
#> I was unable to find any missing LaTeX packages from the error log /tmp/Rtmp2hUviG/file3e5acbc2bbc.log.
#> I was unable to find any missing LaTeX packages from the error log /tmp/Rtmp2hUviG/file3e5a2041179f.log.
#> I was unable to find any missing LaTeX packages from the error log /tmp/Rtmp2hUviG/file3e5a2041179f.log.
#> I was unable to find any missing LaTeX packages from the error log /tmp/Rtmp2hUviG/file3e5a5c74458f.log.
#> I was unable to find any missing LaTeX packages from the error log /tmp/Rtmp2hUviG/file3e5a5c74458f.log.
#> I was unable to find any missing LaTeX packages from the error log /tmp/Rtmp2hUviG/file3e5a30c43c7b.log.
#> I was unable to find any missing LaTeX packages from the error log /tmp/Rtmp2hUviG/file3e5a30c43c7b.log.
#> I was unable to find any missing LaTeX packages from the error log /tmp/Rtmp2hUviG/file3e5a79066614.log.
#> I was unable to find any missing LaTeX packages from the error log /tmp/Rtmp2hUviG/file3e5a79066614.log.
#> I was unable to find any missing LaTeX packages from the error log /tmp/Rtmp2hUviG/file3e5a1b812cb4.log.
#> I was unable to find any missing LaTeX packages from the error log /tmp/Rtmp2hUviG/file3e5a1b812cb4.log.
#> I was unable to find any missing LaTeX packages from the error log /tmp/Rtmp2hUviG/file3e5a5726542c.log.
#> I was unable to find any missing LaTeX packages from the error log /tmp/Rtmp2hUviG/file3e5a5726542c.log.
#> I was unable to find any missing LaTeX packages from the error log /tmp/Rtmp2hUviG/file3e5a1b355d5e.log.
#> I was unable to find any missing LaTeX packages from the error log /tmp/Rtmp2hUviG/file3e5a1b355d5e.log.
#> I was unable to find any missing LaTeX packages from the error log /tmp/Rtmp2hUviG/file3e5a46a4dc14.log.
#> I was unable to find any missing LaTeX packages from the error log /tmp/Rtmp2hUviG/file3e5a46a4dc14.log.
#> I was unable to find any missing LaTeX packages from the error log /tmp/Rtmp2hUviG/file3e5a59367ebd.log.
#> I was unable to find any missing LaTeX packages from the error log /tmp/Rtmp2hUviG/file3e5a59367ebd.log.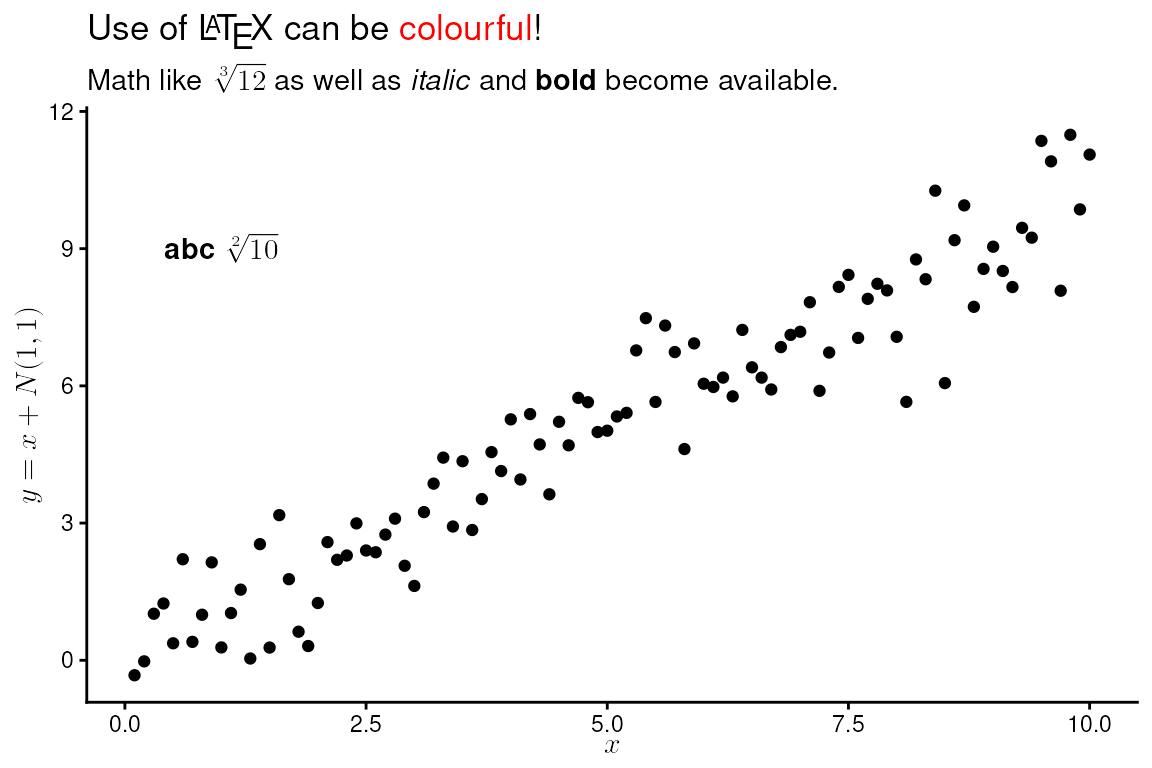
For the first example we use defaults to add an annotation with Pearson’s correlation coefficient.
ggplot(my.data, aes(x, y)) +
  geom_point() +
  stat_correlation(geom = "latex",
                   hjust = 0, vjust = 1)
#> I was unable to find any missing LaTeX packages from the error log /tmp/Rtmp2hUviG/file3e5a371f1fe8.log.
#> I was unable to find any missing LaTeX packages from the error log /tmp/Rtmp2hUviG/file3e5a371f1fe8.log.
#> I was unable to find any missing LaTeX packages from the error log /tmp/Rtmp2hUviG/file3e5a7892f48b.log.
#> I was unable to find any missing LaTeX packages from the error log /tmp/Rtmp2hUviG/file3e5a7892f48b.log.
#> I was unable to find any missing LaTeX packages from the error log /tmp/Rtmp2hUviG/file3e5a30dafd1f.log.
#> I was unable to find any missing LaTeX packages from the error log /tmp/Rtmp2hUviG/file3e5a30dafd1f.log.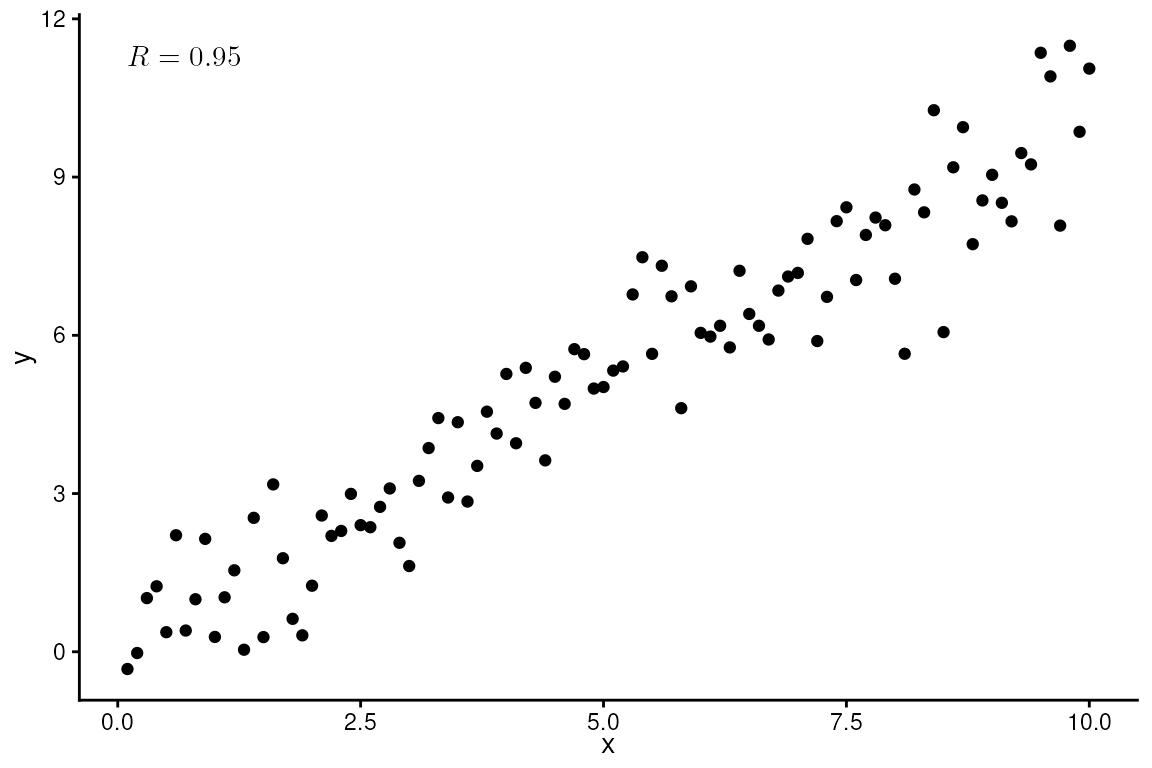
Grouping is supported.
ggplot(my.data, aes(x, y, color = group)) +
  geom_point() +
  stat_correlation(geom = "latex",
                   hjust = 0, vjust = 1)
#> I was unable to find any missing LaTeX packages from the error log /tmp/Rtmp2hUviG/file3e5a50800d31.log.
#> I was unable to find any missing LaTeX packages from the error log /tmp/Rtmp2hUviG/file3e5a50800d31.log.
#> I was unable to find any missing LaTeX packages from the error log /tmp/Rtmp2hUviG/file3e5a6133d240.log.
#> I was unable to find any missing LaTeX packages from the error log /tmp/Rtmp2hUviG/file3e5a6133d240.log.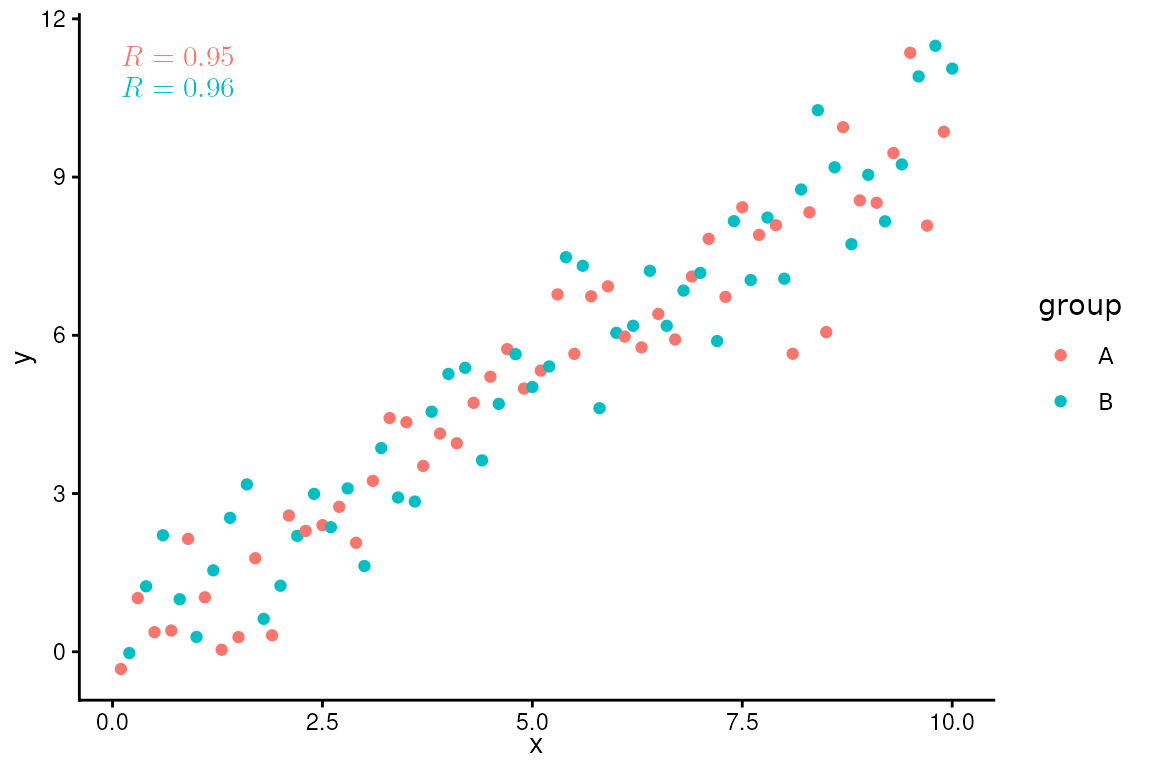
We can also compute Spearman’s rank correlation. (The symbol used for it is the letter rho to distinguish it from Pearson’s correlation for which R or r are used as symbols.)
ggplot(my.data, aes(x, y, color = group)) +
  geom_point() +
  stat_correlation(method = "spearman",
                   geom = "latex",
                   hjust = 0, vjust = 1)
#> I was unable to find any missing LaTeX packages from the error log /tmp/Rtmp2hUviG/file3e5a7451e5c6.log.
#> I was unable to find any missing LaTeX packages from the error log /tmp/Rtmp2hUviG/file3e5a7451e5c6.log.
#> I was unable to find any missing LaTeX packages from the error log /tmp/Rtmp2hUviG/file3e5a12badc10.log.
#> I was unable to find any missing LaTeX packages from the error log /tmp/Rtmp2hUviG/file3e5a12badc10.log.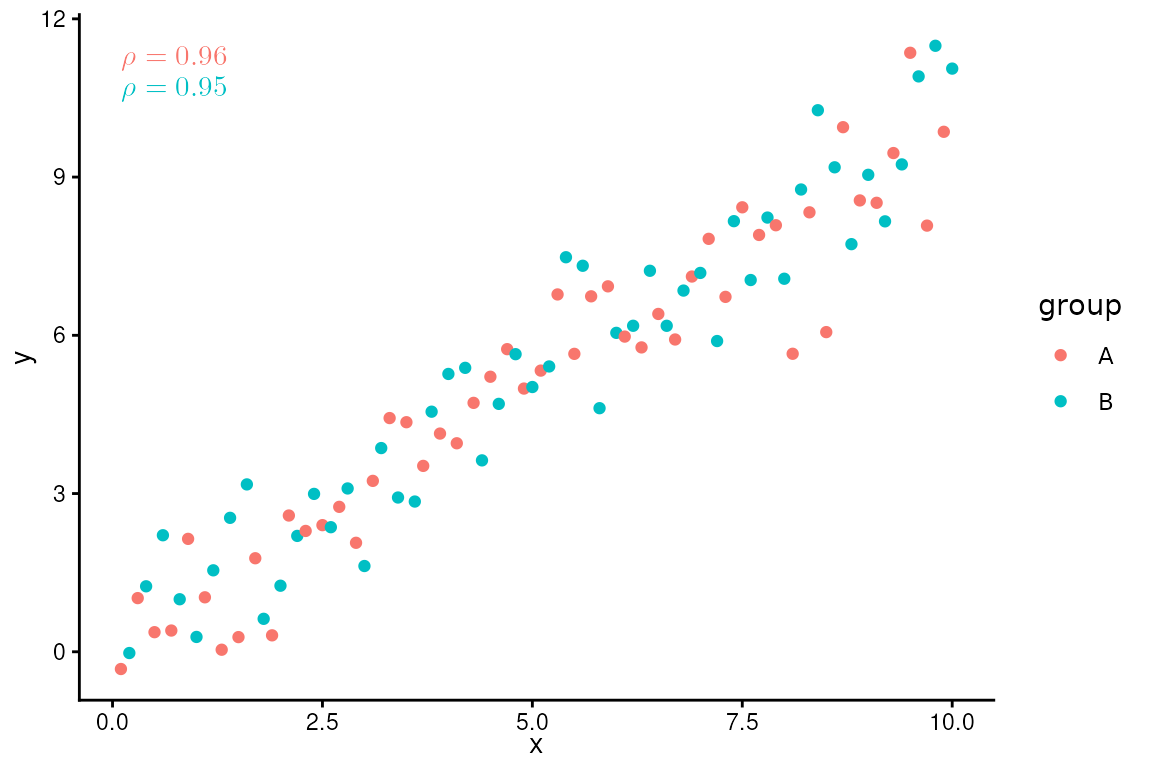
Statistic stat_correlation() generates multiple labels
as listed in the tables above. We can combine them freely within a call
to aes() to customize the annotations, or we can use the
convenience function use_label() to create the mapping.
ggplot(my.data, aes(x, y, color = group)) +
  geom_point() +
  stat_correlation(mapping =
                     use_label("R", "t", "P", "n", sep = ", "),
                   geom = "latex",
                   hjust = 0, vjust = 1)
#> I was unable to find any missing LaTeX packages from the error log /tmp/Rtmp2hUviG/file3e5a37c34a59.log.
#> I was unable to find any missing LaTeX packages from the error log /tmp/Rtmp2hUviG/file3e5a37c34a59.log.
#> I was unable to find any missing LaTeX packages from the error log /tmp/Rtmp2hUviG/file3e5a7c4ba6e3.log.
#> I was unable to find any missing LaTeX packages from the error log /tmp/Rtmp2hUviG/file3e5a7c4ba6e3.log.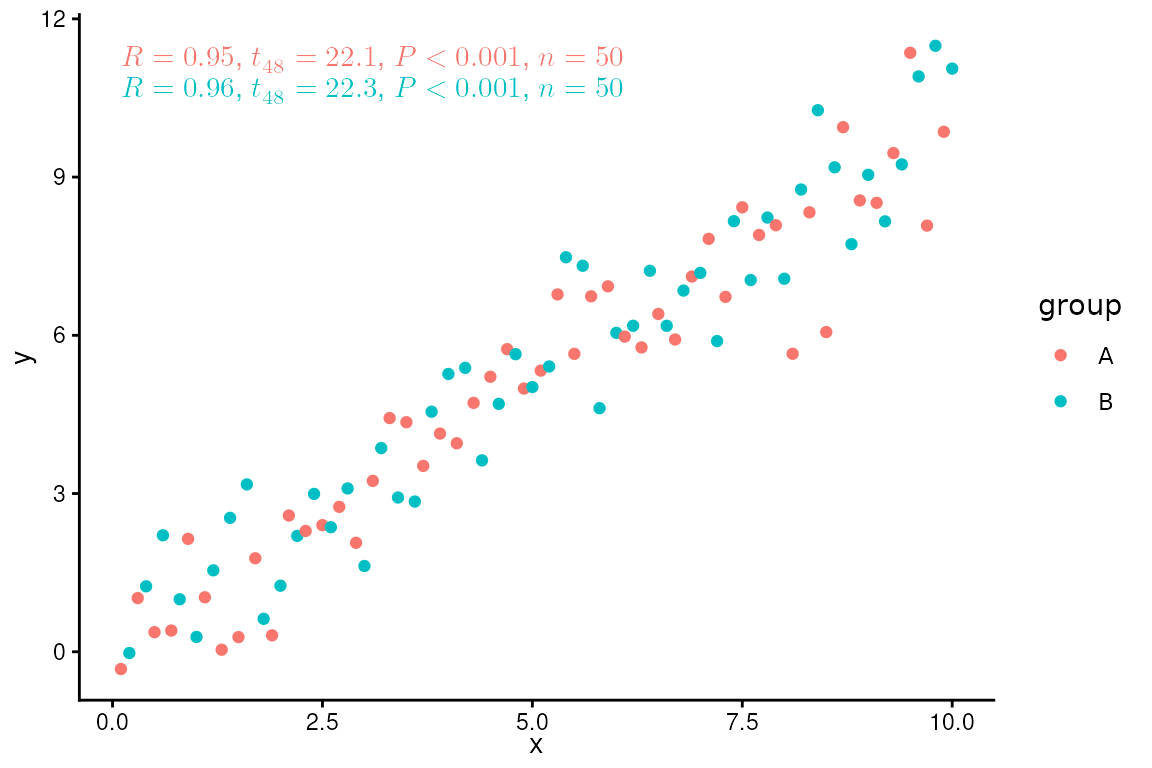
Facets are also supported.
ggplot(my.data, aes(x, y)) +
  geom_point() +
  stat_correlation(geom = "latex", hjust = 0, vjust = 1) +
  facet_wrap(~group)
#> I was unable to find any missing LaTeX packages from the error log /tmp/Rtmp2hUviG/file3e5a2d87fa54.log.
#> I was unable to find any missing LaTeX packages from the error log /tmp/Rtmp2hUviG/file3e5a2d87fa54.log.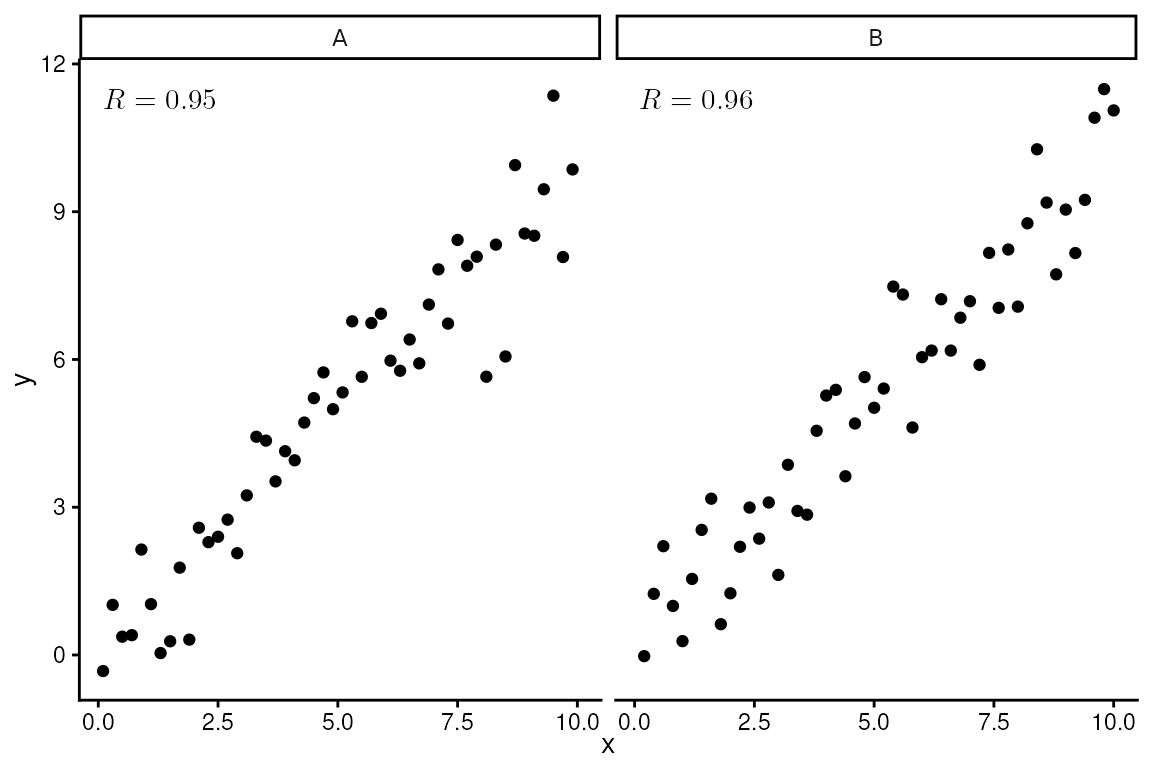
Using the numeric values returned it is possible to set other aesthetics on-the-fly.
ggplot(my.data, aes(x, y)) +
  geom_point() +
  stat_correlation(mapping =
                     aes(color = ifelse(after_stat(cor) > 0.955,
                                        "red", "black")),
                   geom = "latex",
                   hjust = 0, vjust = 1) +
  scale_color_identity() +
  facet_wrap(~group)
#> I was unable to find any missing LaTeX packages from the error log /tmp/Rtmp2hUviG/file3e5ab7fc8be.log.
#> I was unable to find any missing LaTeX packages from the error log /tmp/Rtmp2hUviG/file3e5ab7fc8be.log.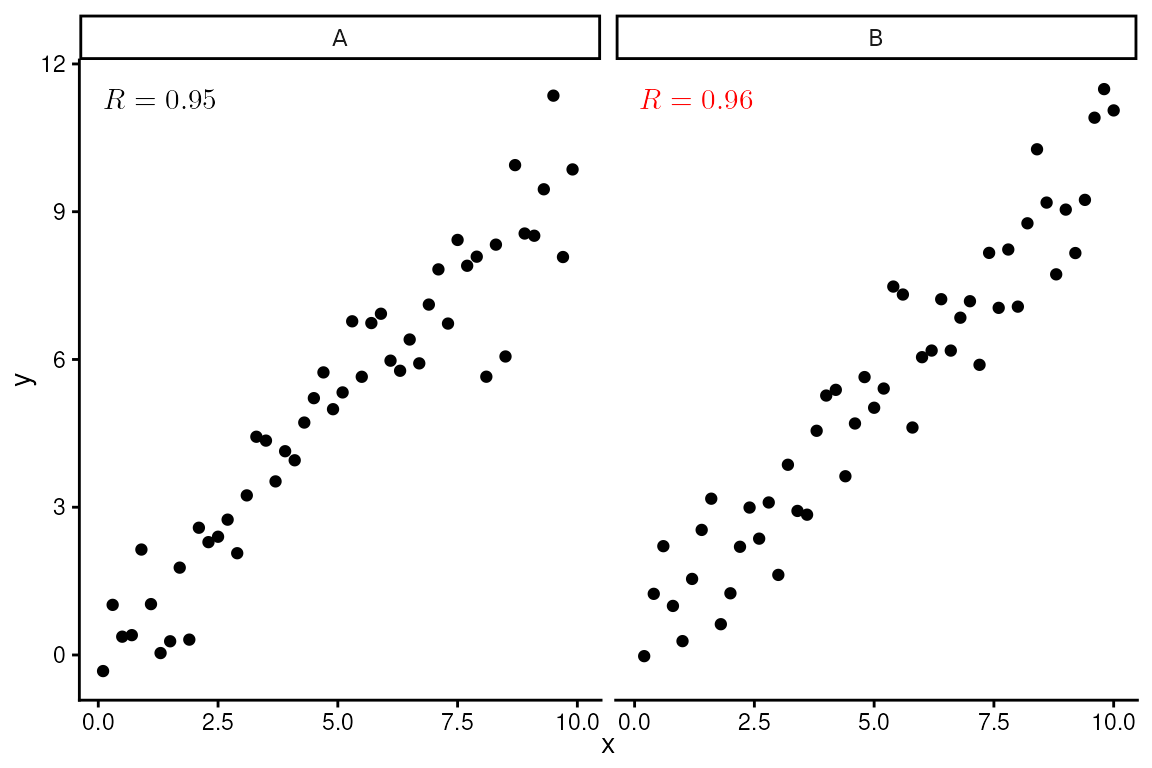
stat_poly_eq()
We first generate a set of artificial data suitable for the plotting examples.
set.seed(4321)
# generate artificial data
x <- 1:100
y <- (x + x^2 + x^3) + rnorm(length(x), mean = 0, sd = mean(x^3) / 4)
y <- y / max(y)
my.data <- data.frame(x,
                      y,
                      group = c("A", "B"),
                      y2 = y * c(1, 2) + c(0, 0.2),
                      block = c("a", "a", "b", "b"),
                      wt = sqrt(x))
formula <- y ~ poly(x, 3, raw = TRUE)
ggplot(my.data, aes(x, y)) +
  geom_point() +
  stat_poly_line(formula = formula) +
  stat_poly_eq(formula = formula,
               geom = "latex",
               hjust = 0, vjust = 1)
#> I was unable to find any missing LaTeX packages from the error log /tmp/Rtmp2hUviG/file3e5a65acef77.log.
#> I was unable to find any missing LaTeX packages from the error log /tmp/Rtmp2hUviG/file3e5a65acef77.log.
#> I was unable to find any missing LaTeX packages from the error log /tmp/Rtmp2hUviG/file3e5a3026bdcf.log.
#> I was unable to find any missing LaTeX packages from the error log /tmp/Rtmp2hUviG/file3e5a3026bdcf.log.
#> I was unable to find any missing LaTeX packages from the error log /tmp/Rtmp2hUviG/file3e5a14d05338.log.
#> I was unable to find any missing LaTeX packages from the error log /tmp/Rtmp2hUviG/file3e5a14d05338.log.
#> I was unable to find any missing LaTeX packages from the error log /tmp/Rtmp2hUviG/file3e5a370a0bc9.log.
#> I was unable to find any missing LaTeX packages from the error log /tmp/Rtmp2hUviG/file3e5a370a0bc9.log.
#> I was unable to find any missing LaTeX packages from the error log /tmp/Rtmp2hUviG/file3e5a2ff9c65f.log.
#> I was unable to find any missing LaTeX packages from the error log /tmp/Rtmp2hUviG/file3e5a2ff9c65f.log.
#> I was unable to find any missing LaTeX packages from the error log /tmp/Rtmp2hUviG/file3e5a2b55d198.log.
#> I was unable to find any missing LaTeX packages from the error log /tmp/Rtmp2hUviG/file3e5a2b55d198.log.
#> I was unable to find any missing LaTeX packages from the error log /tmp/Rtmp2hUviG/file3e5a654a29e.log.
#> I was unable to find any missing LaTeX packages from the error log /tmp/Rtmp2hUviG/file3e5a654a29e.log.
#> I was unable to find any missing LaTeX packages from the error log /tmp/Rtmp2hUviG/file3e5a52652da1.log.
#> I was unable to find any missing LaTeX packages from the error log /tmp/Rtmp2hUviG/file3e5a52652da1.log.
#> I was unable to find any missing LaTeX packages from the error log /tmp/Rtmp2hUviG/file3e5a7b19c6b0.log.
#> I was unable to find any missing LaTeX packages from the error log /tmp/Rtmp2hUviG/file3e5a7b19c6b0.log.
#> I was unable to find any missing LaTeX packages from the error log /tmp/Rtmp2hUviG/file3e5a27a6922c.log.
#> I was unable to find any missing LaTeX packages from the error log /tmp/Rtmp2hUviG/file3e5a27a6922c.log.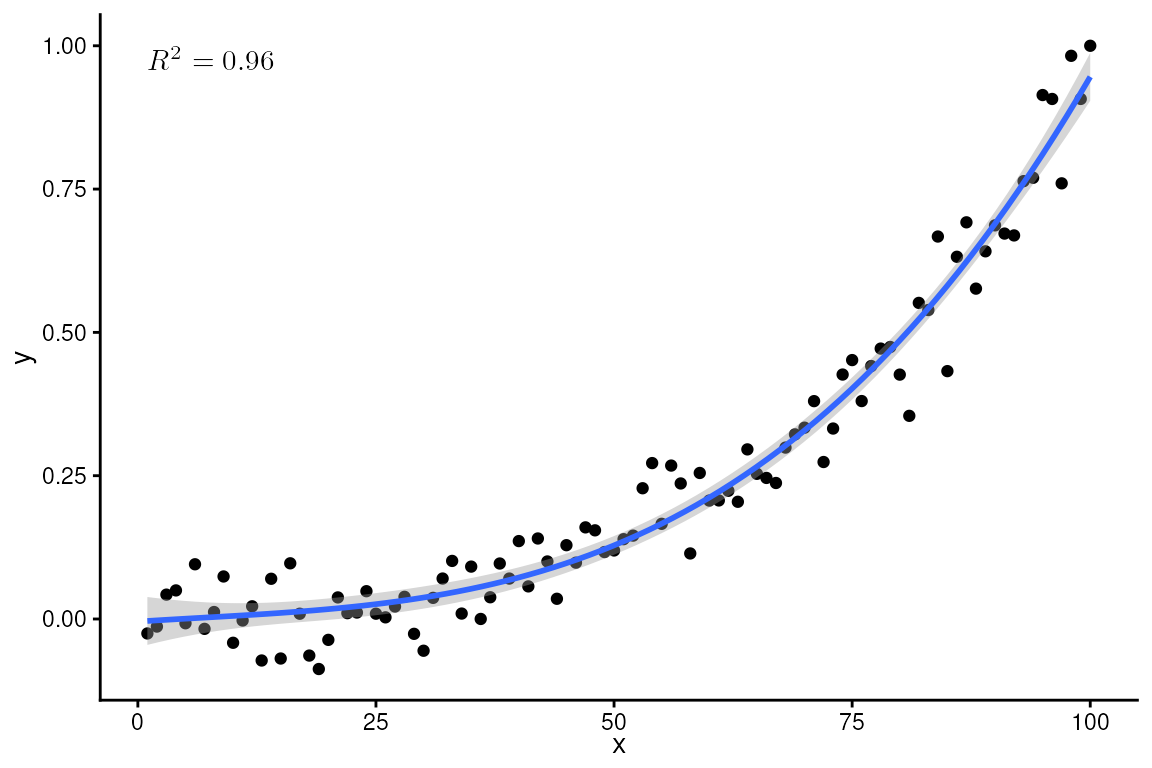
formula <- y ~ poly(x, 3, raw = TRUE)
ggplot(my.data, aes(x, y)) +
  geom_point() +
  stat_poly_line(formula = formula) +
  stat_poly_eq(mapping = use_label("eq"), formula = formula,
               geom = "latex", hjust = 0, vjust = 1)
#> I was unable to find any missing LaTeX packages from the error log /tmp/Rtmp2hUviG/file3e5a4b54d5ee.log.
#> I was unable to find any missing LaTeX packages from the error log /tmp/Rtmp2hUviG/file3e5a4b54d5ee.log.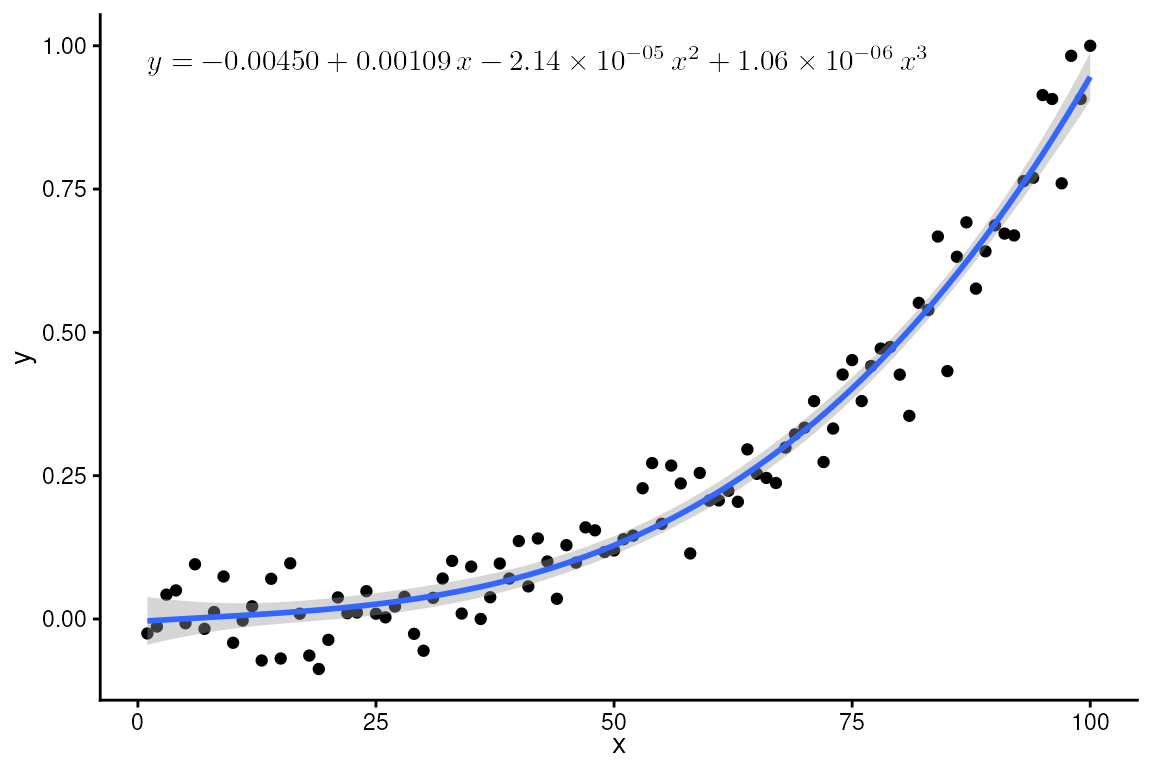
Mapping to label aesthetic created with
use_label() which is based on paste(). The
backslash "\" in R character strings has to be
escaped as "\\", so $\LaTeX$ markup for newline, \\,
becomes \\\\.
formula <- y ~ poly(x, 3, raw = TRUE)
ggplot(my.data, aes(x, y)) +
  geom_point() +
  stat_poly_line(formula = formula) +
  stat_poly_eq(mapping = use_label("eq", "adj.R2", sep = "\\\\"),
               formula = formula,
               geom = "latex",
               hjust = 0, vjust = 1)
#> I was unable to find any missing LaTeX packages from the error log /tmp/Rtmp2hUviG/file3e5a7523fb65.log.
#> I was unable to find any missing LaTeX packages from the error log /tmp/Rtmp2hUviG/file3e5a7523fb65.log.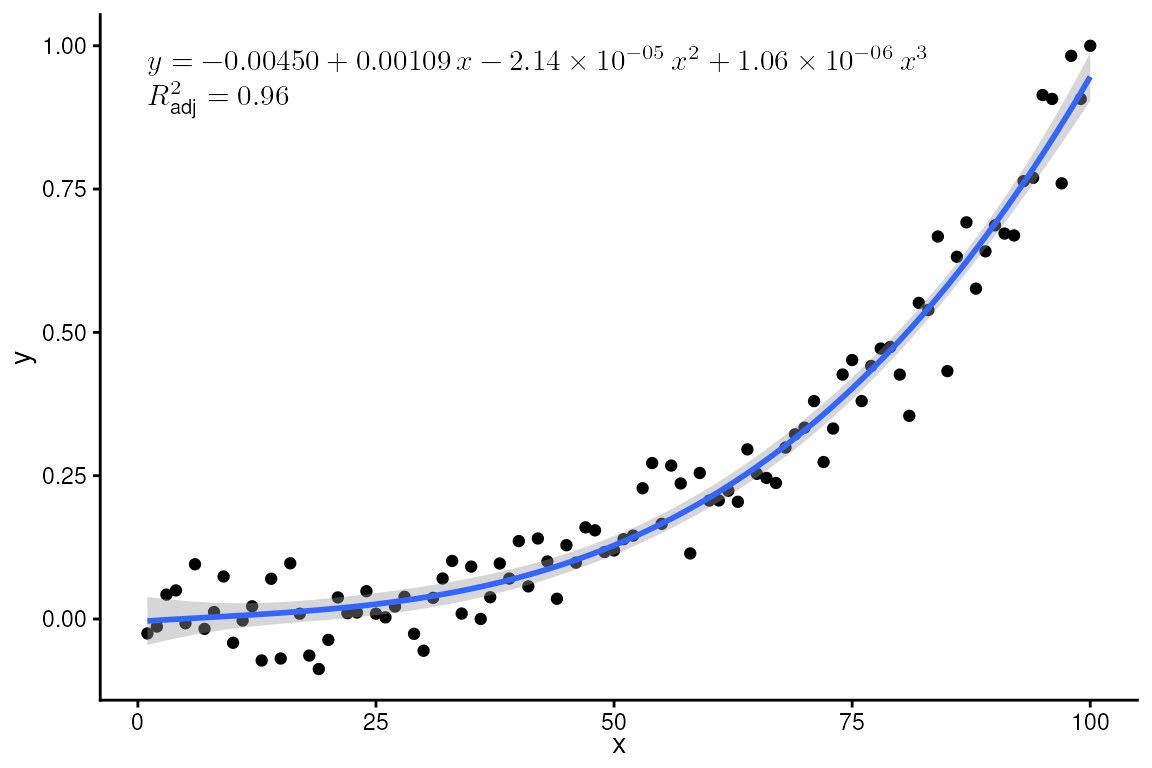
Mapping to label aesthetic created with
f_use_label() which is based on sprintf().
formula <- y ~ poly(x, 3, raw = TRUE)
ggplot(my.data, aes(x, y)) +
  geom_point() +
  stat_poly_line(formula = formula) +
  stat_poly_eq(f_use_label("eq", "R2", "F", "P",
                           format = "%s\\\\%s, %s, %s"),
               formula = formula, size = 4,
               geom = "latex",
               hjust = 0, vjust = 1)
#> I was unable to find any missing LaTeX packages from the error log /tmp/Rtmp2hUviG/file3e5a6a71fc9.log.
#> I was unable to find any missing LaTeX packages from the error log /tmp/Rtmp2hUviG/file3e5a6a71fc9.log.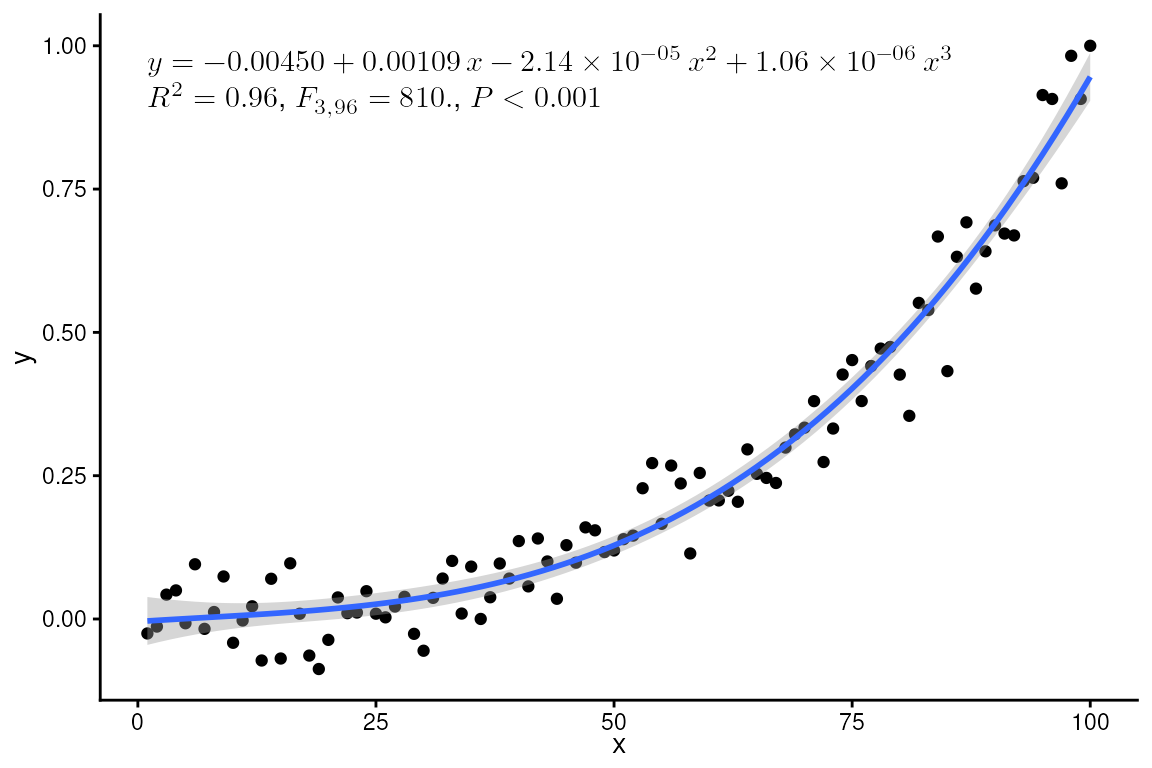
Mapping to label aesthetic created with
aes() together with paste().
formula <- y ~ poly(x, 3, raw = TRUE)
ggplot(my.data, aes(x, y)) +
  geom_point() +
  stat_poly_line(formula = formula) +
  stat_poly_eq(aes(label =
                     after_stat(
                       paste(eq.label, "\\\\",
                             rr.label, ", ", f.value.label, ", ", p.value.label,
                             sep = ""))),
               formula = formula, size = 4,
               geom = "latex",
               hjust = 0, vjust = 1)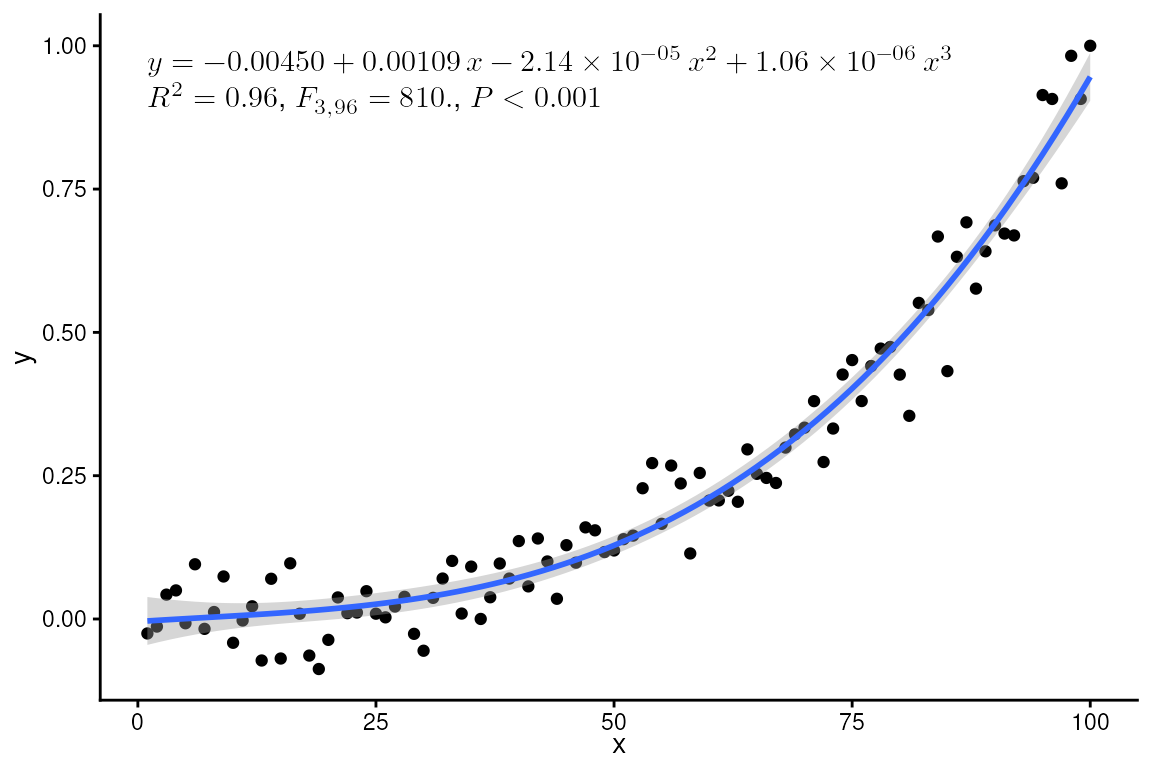
Replacing the lhs, requires $\LaTeX$ encoding, and, as above, escaping
"\" in R character strings as
"\\".
formula <- y ~ poly(x, 3, raw = TRUE)
ggplot(my.data, aes(x, y)) +
  geom_point() +
  stat_poly_line(formula = formula) +
  stat_poly_eq(mapping = use_label("eq"),
               eq.with.lhs = "\\hat{y} = ",
               formula = formula,
               geom = "latex",
               hjust = 0, vjust = 1)
#> I was unable to find any missing LaTeX packages from the error log /tmp/Rtmp2hUviG/file3e5a37c7738f.log.
#> I was unable to find any missing LaTeX packages from the error log /tmp/Rtmp2hUviG/file3e5a37c7738f.log.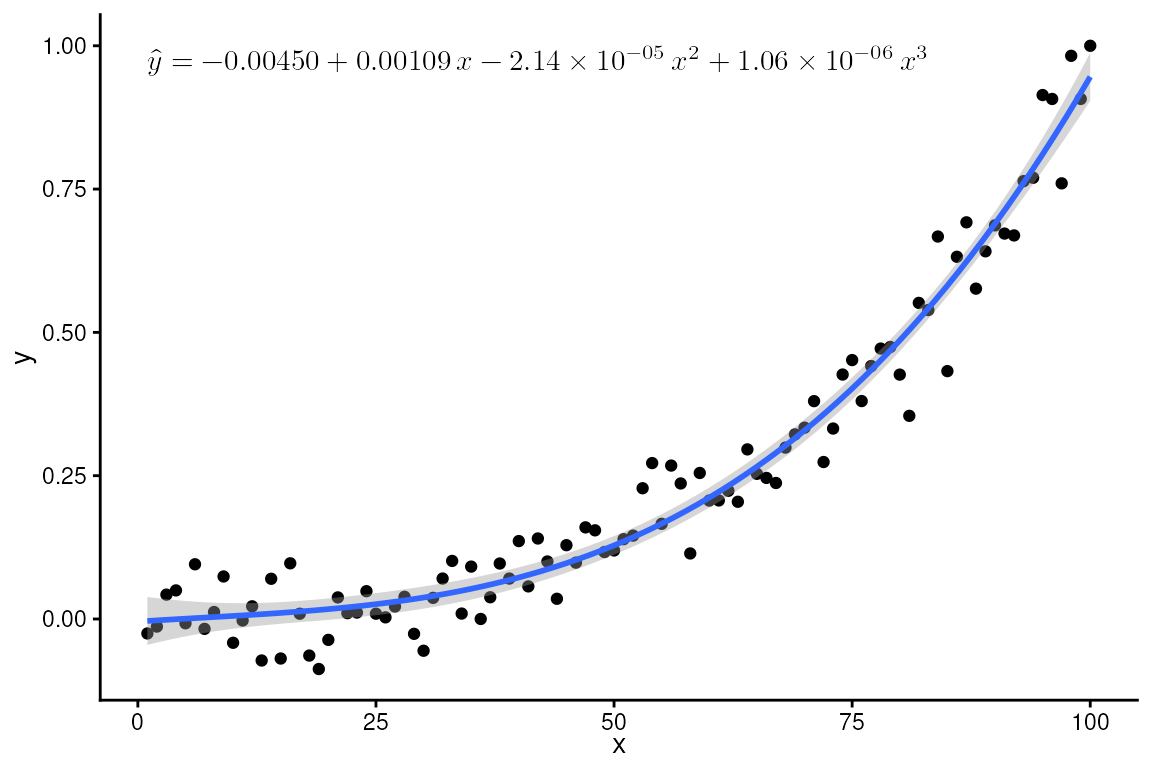
Replacing both the lhs and the independent variable symbol used on the rhs.
formula <- y ~ poly(x, 3, raw = TRUE)
ggplot(my.data, aes(x, y)) +
  geom_point() +
  stat_poly_line(formula = formula) +
  stat_poly_eq(mapping = use_label("eq", "R2", sep = "\\\\"),
               eq.with.lhs = "h = ",
               eq.x.rhs = "z",
               formula = formula,
               geom = "latex",
               hjust = 0, vjust = 1)
#> I was unable to find any missing LaTeX packages from the error log /tmp/Rtmp2hUviG/file3e5a10786283.log.
#> I was unable to find any missing LaTeX packages from the error log /tmp/Rtmp2hUviG/file3e5a10786283.log.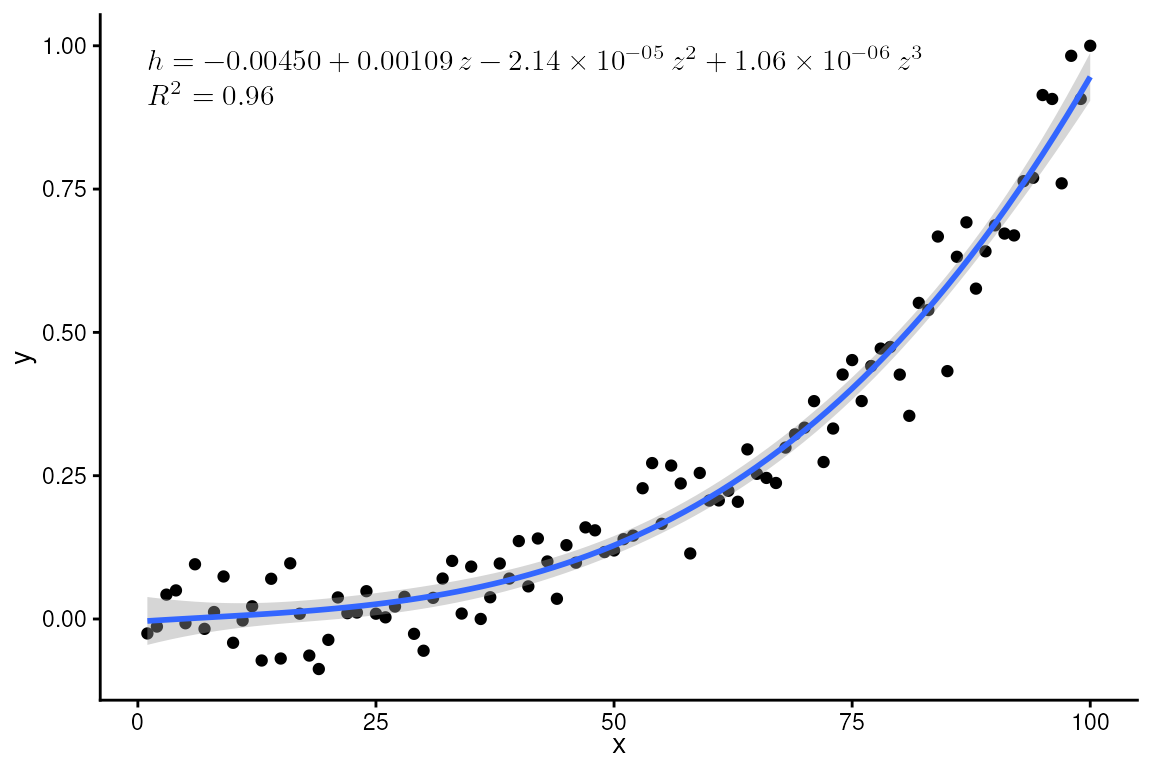
formula <- y ~ poly(x, 2, raw = TRUE)
ggplot(my.data, aes(x, log10(y + 1e6))) +
  geom_point() +
  stat_poly_line(formula = formula) +
  stat_poly_eq(mapping = use_label("eq"),
               eq.with.lhs = "\\log_{10}(\\delta + 10^6) = ",
               eq.x.rhs = "\\Omega",
               formula = formula,
               geom = "latex",
               hjust = 0, vjust = 1) +
  labs(y = "$\\log_{10}(\\delta + 10^6)$", x = "$\\Omega$")
#> I was unable to find any missing LaTeX packages from the error log /tmp/Rtmp2hUviG/file3e5a7367bdf7.log.
#> I was unable to find any missing LaTeX packages from the error log /tmp/Rtmp2hUviG/file3e5a7367bdf7.log.
#> I was unable to find any missing LaTeX packages from the error log /tmp/Rtmp2hUviG/file3e5a98fa229.log.
#> I was unable to find any missing LaTeX packages from the error log /tmp/Rtmp2hUviG/file3e5a98fa229.log.
#> I was unable to find any missing LaTeX packages from the error log /tmp/Rtmp2hUviG/file3e5a36408cca.log.
#> I was unable to find any missing LaTeX packages from the error log /tmp/Rtmp2hUviG/file3e5a36408cca.log.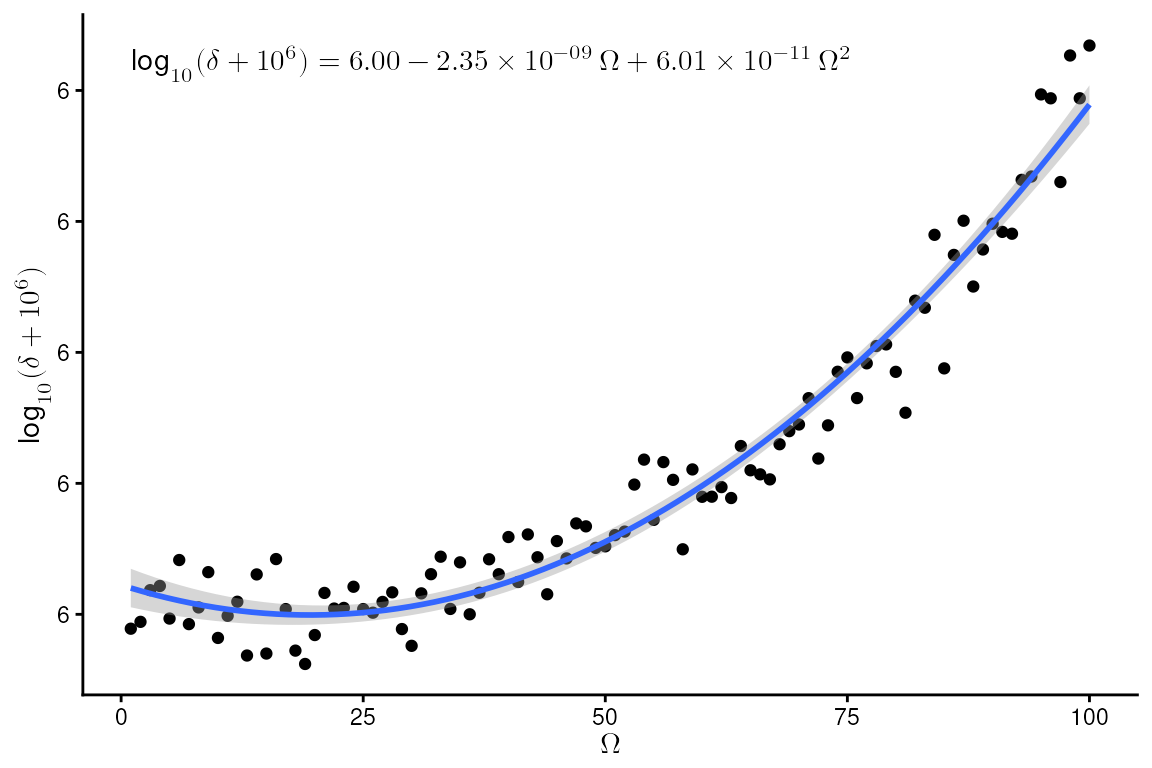
formula <- y ~ poly(x, 3, raw = TRUE)
ggplot(my.data, aes(x, y2, linetype = group, grp.label = group)) +
  geom_point() +
  stat_poly_line(formula = formula, color = "black") +
  stat_poly_eq(f_use_label("grp", "eq", format = "\\strong{%s:}\\ %s"),
    formula = formula,
    geom = "latex",
    hjust = 0, vjust = 1,
    vstep = 0.07)
#> I was unable to find any missing LaTeX packages from the error log /tmp/Rtmp2hUviG/file3e5a7ce5d57a.log.
#> I was unable to find any missing LaTeX packages from the error log /tmp/Rtmp2hUviG/file3e5a7ce5d57a.log.
#> I was unable to find any missing LaTeX packages from the error log /tmp/Rtmp2hUviG/file3e5a3b8ba875.log.
#> I was unable to find any missing LaTeX packages from the error log /tmp/Rtmp2hUviG/file3e5a3b8ba875.log.
#> I was unable to find any missing LaTeX packages from the error log /tmp/Rtmp2hUviG/file3e5a79329b6c.log.
#> I was unable to find any missing LaTeX packages from the error log /tmp/Rtmp2hUviG/file3e5a79329b6c.log.
#> I was unable to find any missing LaTeX packages from the error log /tmp/Rtmp2hUviG/file3e5a4f9dc51d.log.
#> I was unable to find any missing LaTeX packages from the error log /tmp/Rtmp2hUviG/file3e5a4f9dc51d.log.
#> I was unable to find any missing LaTeX packages from the error log /tmp/Rtmp2hUviG/file3e5a2e479cce.log.
#> I was unable to find any missing LaTeX packages from the error log /tmp/Rtmp2hUviG/file3e5a2e479cce.log.
#> I was unable to find any missing LaTeX packages from the error log /tmp/Rtmp2hUviG/file3e5a2ac26efa.log.
#> I was unable to find any missing LaTeX packages from the error log /tmp/Rtmp2hUviG/file3e5a2ac26efa.log.
#> I was unable to find any missing LaTeX packages from the error log /tmp/Rtmp2hUviG/file3e5a12b58e95.log.
#> I was unable to find any missing LaTeX packages from the error log /tmp/Rtmp2hUviG/file3e5a12b58e95.log.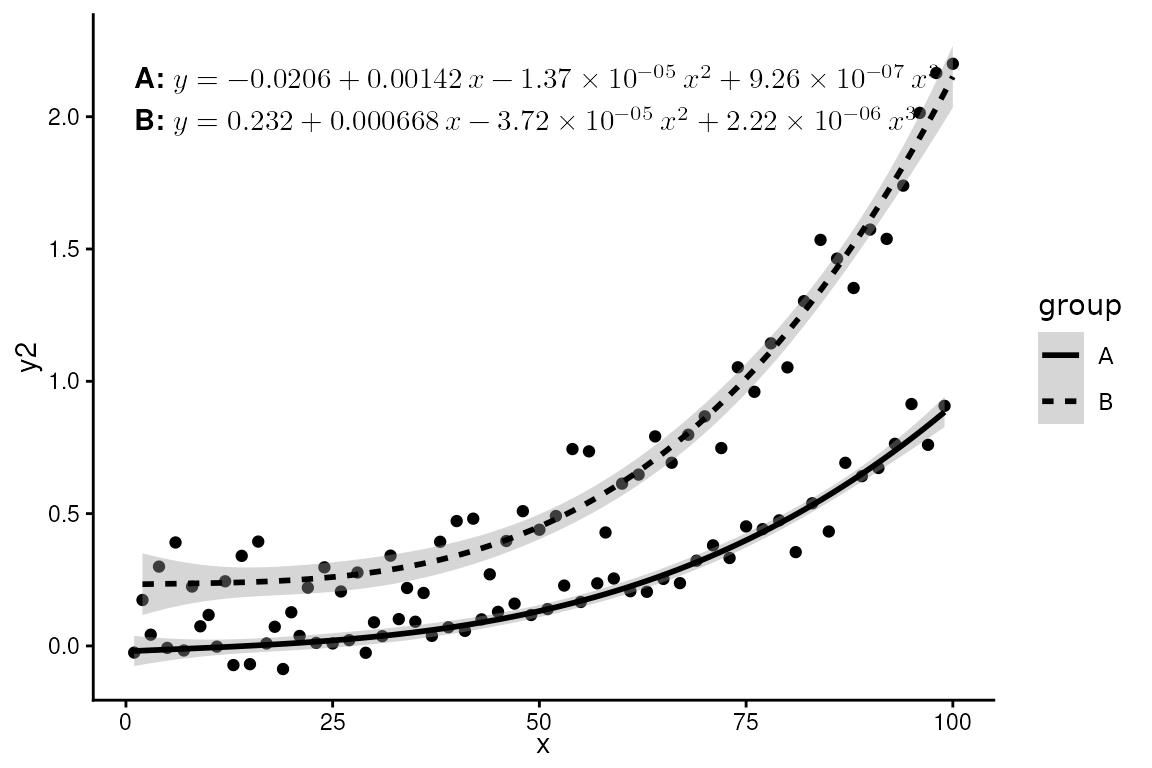
ggplot(my.data, aes(x, y)) +
  geom_point() +
  stat_poly_line(color = "blue") +
  stat_poly_eq(mapping = use_label("R2", "eq", sep = ", "),
               color = "blue",
               geom = "latex",
               hjust = 0, vjust = 1) +
  stat_poly_line(color = "red",
                 orientation = "y") +
  stat_poly_eq(mapping = use_label("R2", "eq", sep = ", "),
               color = "red",
               geom = "latex",
               hjust = 0, vjust = 1,
               orientation = "y",
               label.y = 0.9)
#> I was unable to find any missing LaTeX packages from the error log /tmp/Rtmp2hUviG/file3e5ac8ef61e.log.
#> I was unable to find any missing LaTeX packages from the error log /tmp/Rtmp2hUviG/file3e5ac8ef61e.log.
#> I was unable to find any missing LaTeX packages from the error log /tmp/Rtmp2hUviG/file3e5a3a0068a5.log.
#> I was unable to find any missing LaTeX packages from the error log /tmp/Rtmp2hUviG/file3e5a3a0068a5.log.
#> I was unable to find any missing LaTeX packages from the error log /tmp/Rtmp2hUviG/file3e5a5a0d16a7.log.
#> I was unable to find any missing LaTeX packages from the error log /tmp/Rtmp2hUviG/file3e5a5a0d16a7.log.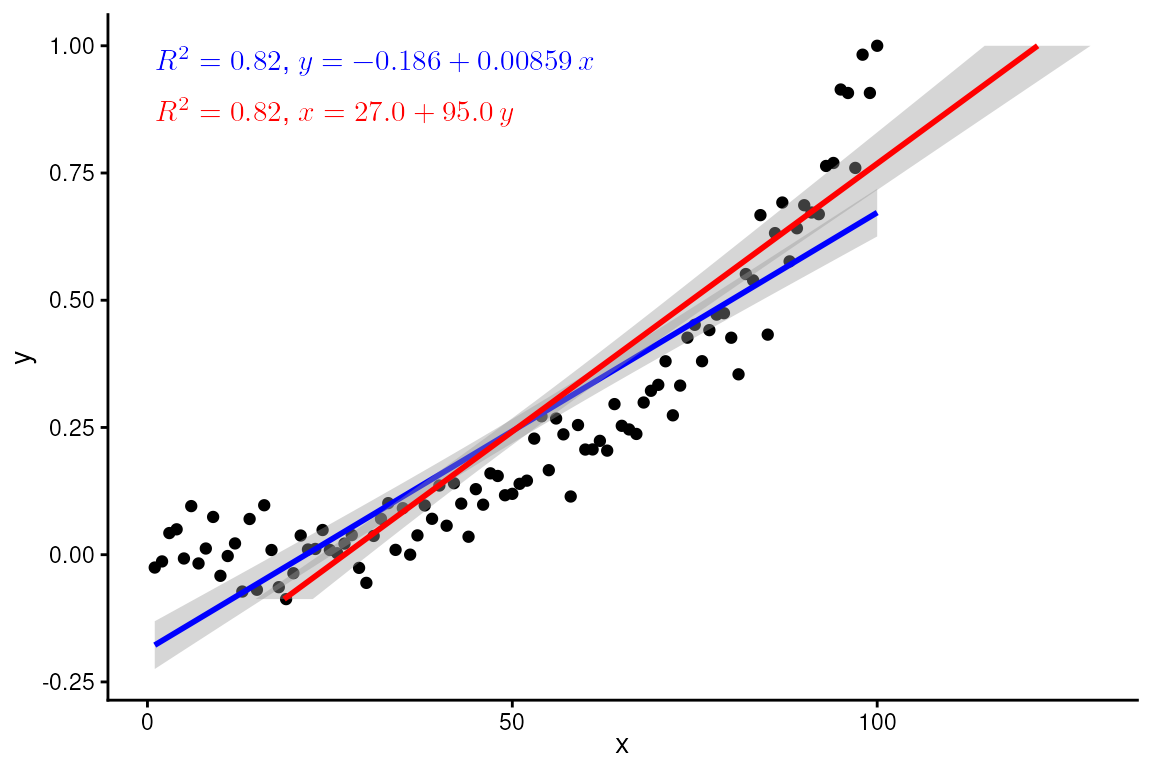
stat_ma_eq() and stat_ma_line()
ggplot(my.data, aes(x, y)) +
  geom_point() +
  stat_ma_line() +
  stat_ma_eq(mapping = use_label("eq", "R2", "P", "theta", sep = ", "),
             geom = "latex",
             hjust = 0, vjust = 1)
#> I was unable to find any missing LaTeX packages from the error log /tmp/Rtmp2hUviG/file3e5a780008bc.log.
#> I was unable to find any missing LaTeX packages from the error log /tmp/Rtmp2hUviG/file3e5a780008bc.log.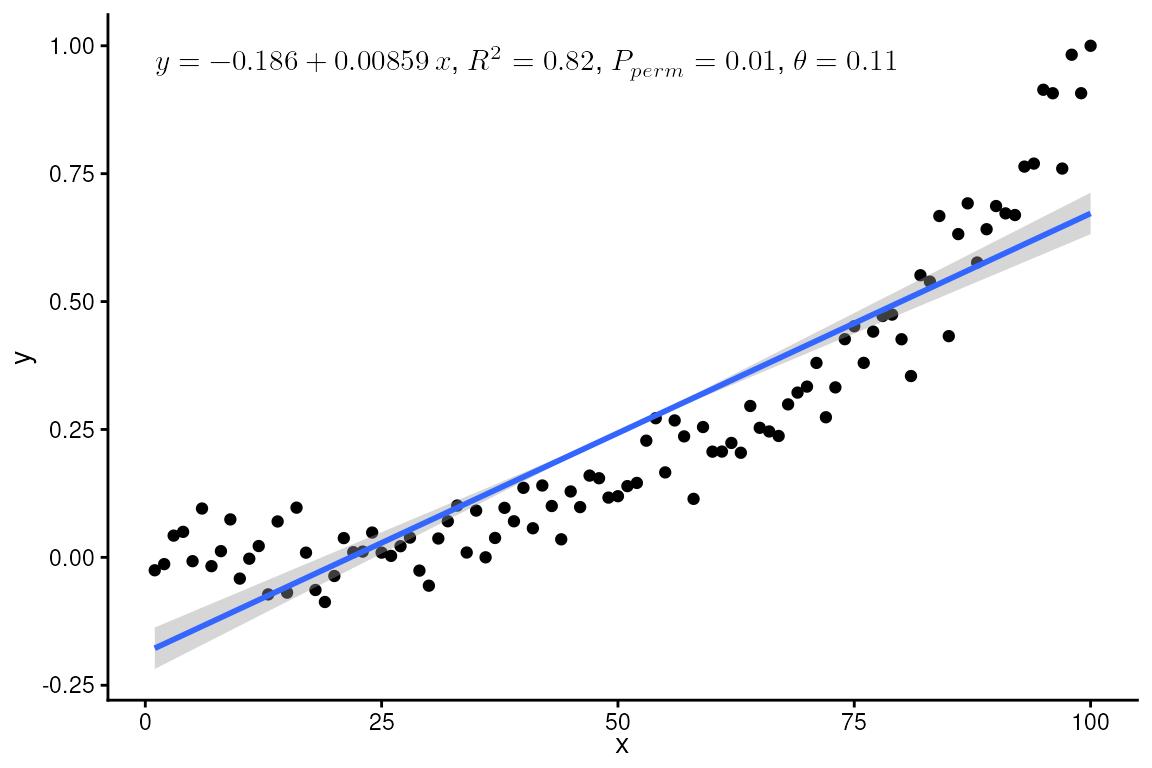
stat_quant_eq()
ggplot(my.data, aes(x, y)) +
  geom_point() +
  stat_quant_band(formula = formula,
                  color = "black", fill = "grey60") +
  stat_quant_eq(formula = formula,
                geom = "latex",
                hjust = 0, vjust = 1)
#> I was unable to find any missing LaTeX packages from the error log /tmp/Rtmp2hUviG/file3e5a65091906.log.
#> I was unable to find any missing LaTeX packages from the error log /tmp/Rtmp2hUviG/file3e5a65091906.log.
#> I was unable to find any missing LaTeX packages from the error log /tmp/Rtmp2hUviG/file3e5a4f9d30c3.log.
#> I was unable to find any missing LaTeX packages from the error log /tmp/Rtmp2hUviG/file3e5a4f9d30c3.log.
#> I was unable to find any missing LaTeX packages from the error log /tmp/Rtmp2hUviG/file3e5abd0afe0.log.
#> I was unable to find any missing LaTeX packages from the error log /tmp/Rtmp2hUviG/file3e5abd0afe0.log.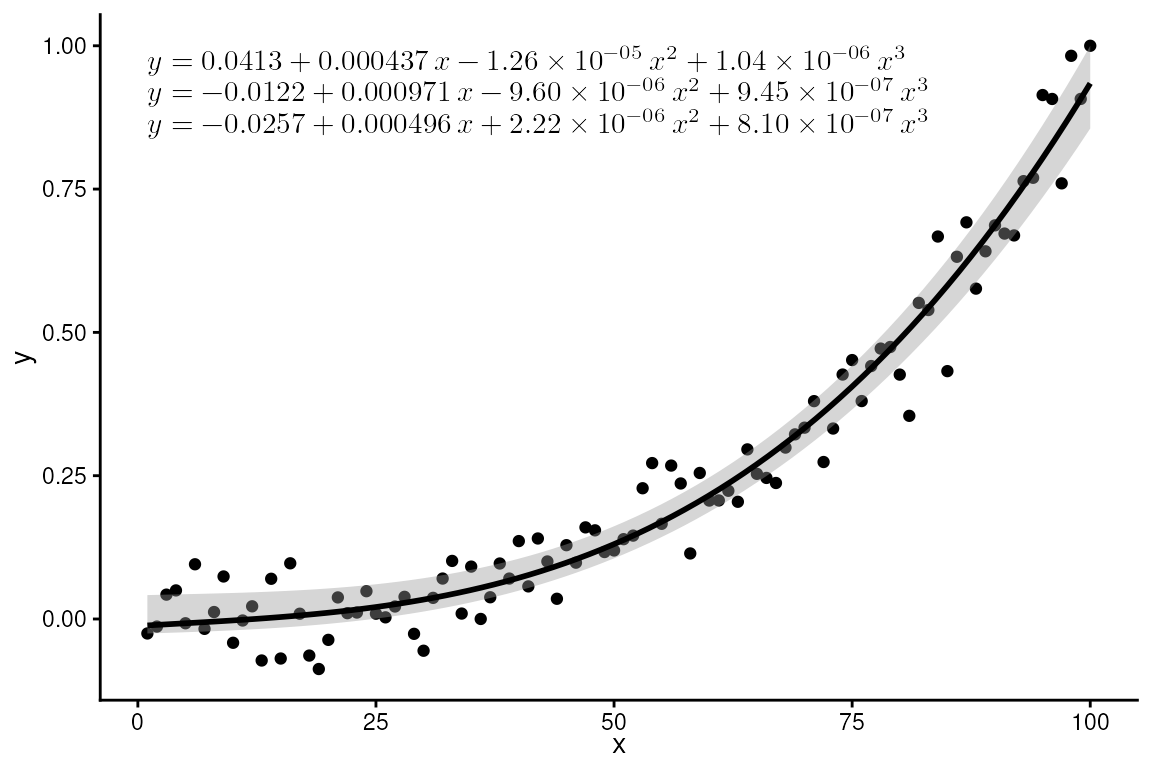
ggplot(my.data, aes(x, y)) +
  geom_point() +
  stat_quant_band(formula = formula,
                  color = "black", fill = "grey60") +
  stat_quant_eq(f_use_label("qtl", "eq", format = "\\strong{%s:}\\ %s"),
                formula = formula,
                geom = "latex", hjust = 0, vjust = 1, vstep = 0.07)
#> I was unable to find any missing LaTeX packages from the error log /tmp/Rtmp2hUviG/file3e5a7b47ed9c.log.
#> I was unable to find any missing LaTeX packages from the error log /tmp/Rtmp2hUviG/file3e5a7b47ed9c.log.
#> I was unable to find any missing LaTeX packages from the error log /tmp/Rtmp2hUviG/file3e5a79f2eadf.log.
#> I was unable to find any missing LaTeX packages from the error log /tmp/Rtmp2hUviG/file3e5a79f2eadf.log.
#> I was unable to find any missing LaTeX packages from the error log /tmp/Rtmp2hUviG/file3e5a3f15c7b0.log.
#> I was unable to find any missing LaTeX packages from the error log /tmp/Rtmp2hUviG/file3e5a3f15c7b0.log.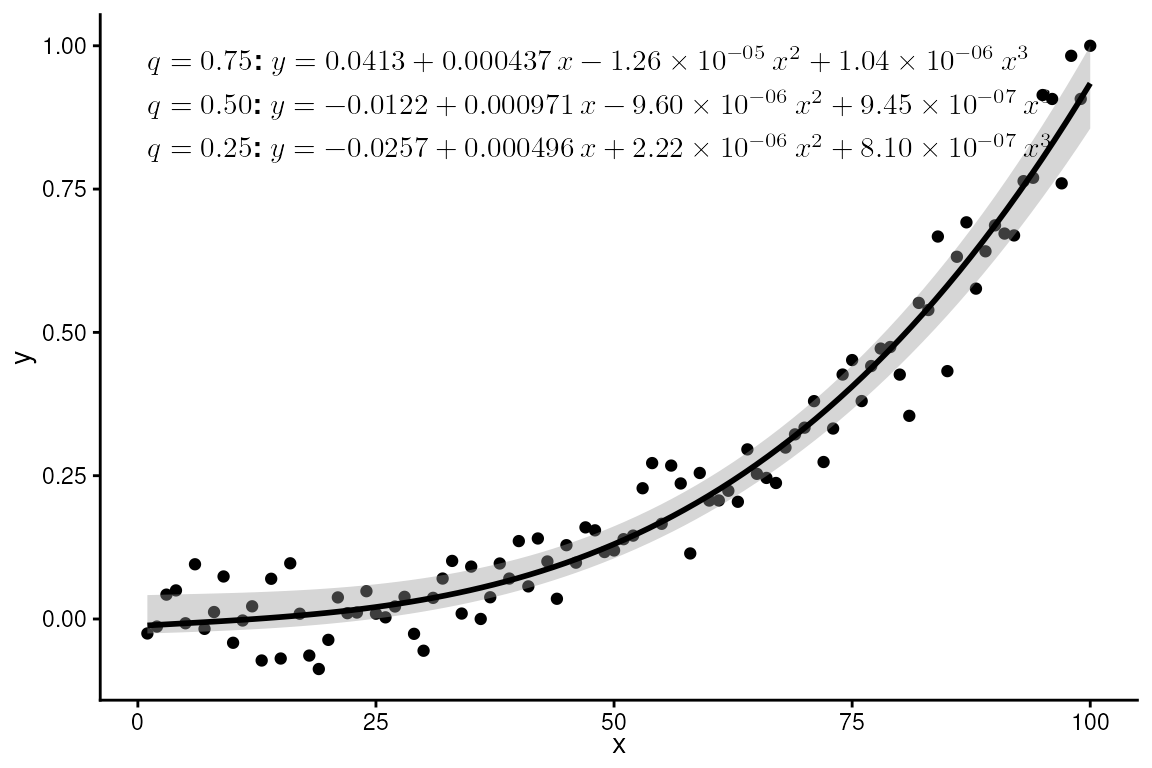
stat_multcomp()
stat_multcomp() depends on
geom_text_pairwise() from package ‘ggpp’, which does not
have a $\LaTeX$-based equivalent
yet.
# position of contrasts' bars (manual)
ggplot(mpg, aes(factor(cyl), hwy)) +
  geom_boxplot(width = 0.33)  +
  stat_multcomp(p.adjust.method = "bonferroni",
                adj.method.tag = 3,
                size = 2.75) +
  expand_limits(y = 0)
#> I was unable to find any missing LaTeX packages from the error log /tmp/Rtmp2hUviG/file3e5a7671d6cb.log.
#> I was unable to find any missing LaTeX packages from the error log /tmp/Rtmp2hUviG/file3e5a7671d6cb.log.
#> I was unable to find any missing LaTeX packages from the error log /tmp/Rtmp2hUviG/file3e5a3ead2393.log.
#> I was unable to find any missing LaTeX packages from the error log /tmp/Rtmp2hUviG/file3e5a3ead2393.log.
#> I was unable to find any missing LaTeX packages from the error log /tmp/Rtmp2hUviG/file3e5a4192ae6.log.
#> I was unable to find any missing LaTeX packages from the error log /tmp/Rtmp2hUviG/file3e5a4192ae6.log.
#> I was unable to find any missing LaTeX packages from the error log /tmp/Rtmp2hUviG/file3e5a4da97cfb.log.
#> I was unable to find any missing LaTeX packages from the error log /tmp/Rtmp2hUviG/file3e5a4da97cfb.log.
#> I was unable to find any missing LaTeX packages from the error log /tmp/Rtmp2hUviG/file3e5a4b7c7495.log.
#> I was unable to find any missing LaTeX packages from the error log /tmp/Rtmp2hUviG/file3e5a4b7c7495.log.
#> I was unable to find any missing LaTeX packages from the error log /tmp/Rtmp2hUviG/file3e5a319a1432.log.
#> I was unable to find any missing LaTeX packages from the error log /tmp/Rtmp2hUviG/file3e5a319a1432.log.
#> I was unable to find any missing LaTeX packages from the error log /tmp/Rtmp2hUviG/file3e5a7c23c8e6.log.
#> I was unable to find any missing LaTeX packages from the error log /tmp/Rtmp2hUviG/file3e5a7c23c8e6.log.
#> I was unable to find any missing LaTeX packages from the error log /tmp/Rtmp2hUviG/file3e5a27b82ccd.log.
#> I was unable to find any missing LaTeX packages from the error log /tmp/Rtmp2hUviG/file3e5a27b82ccd.log.
#> I was unable to find any missing LaTeX packages from the error log /tmp/Rtmp2hUviG/file3e5a74a45da3.log.
#> I was unable to find any missing LaTeX packages from the error log /tmp/Rtmp2hUviG/file3e5a74a45da3.log.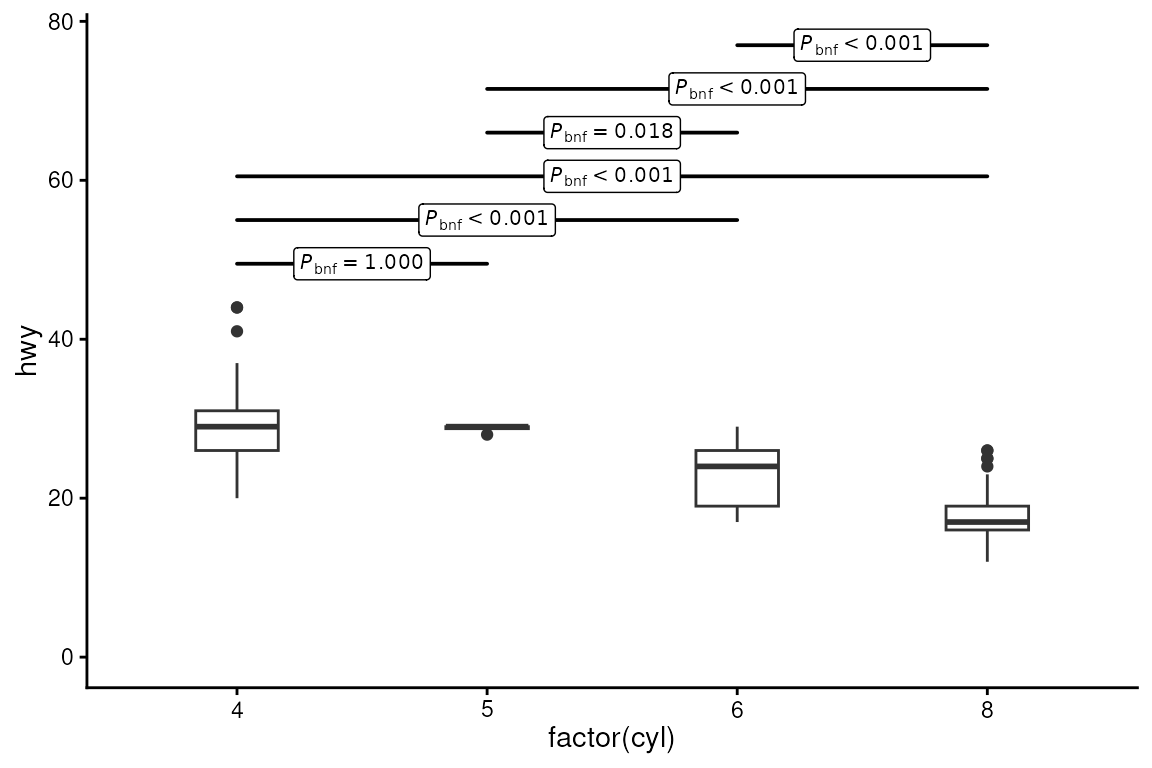
Using other statistics
The label helper functions from ‘ggpmisc’ can be used in
calls to aes() or elsewhere in user code to generate
formated labels from numeric values. By passing
output.type = "latex.eqn" the generated label is formatted
as a $\LaTeX$ equation suitable for
geom_latex().
ggplot(my.data, aes(x, y)) +
  geom_point() +
  stat_panel_counts(geom = "latex",
                    label.x = "left",
                    mapping = aes(
                      label = italic_label(after_stat(count), "n",
                                           output.type = "latex.eqn"))
  )
#> I was unable to find any missing LaTeX packages from the error log /tmp/Rtmp2hUviG/file3e5a66fc6b35.log.
#> I was unable to find any missing LaTeX packages from the error log /tmp/Rtmp2hUviG/file3e5a66fc6b35.log.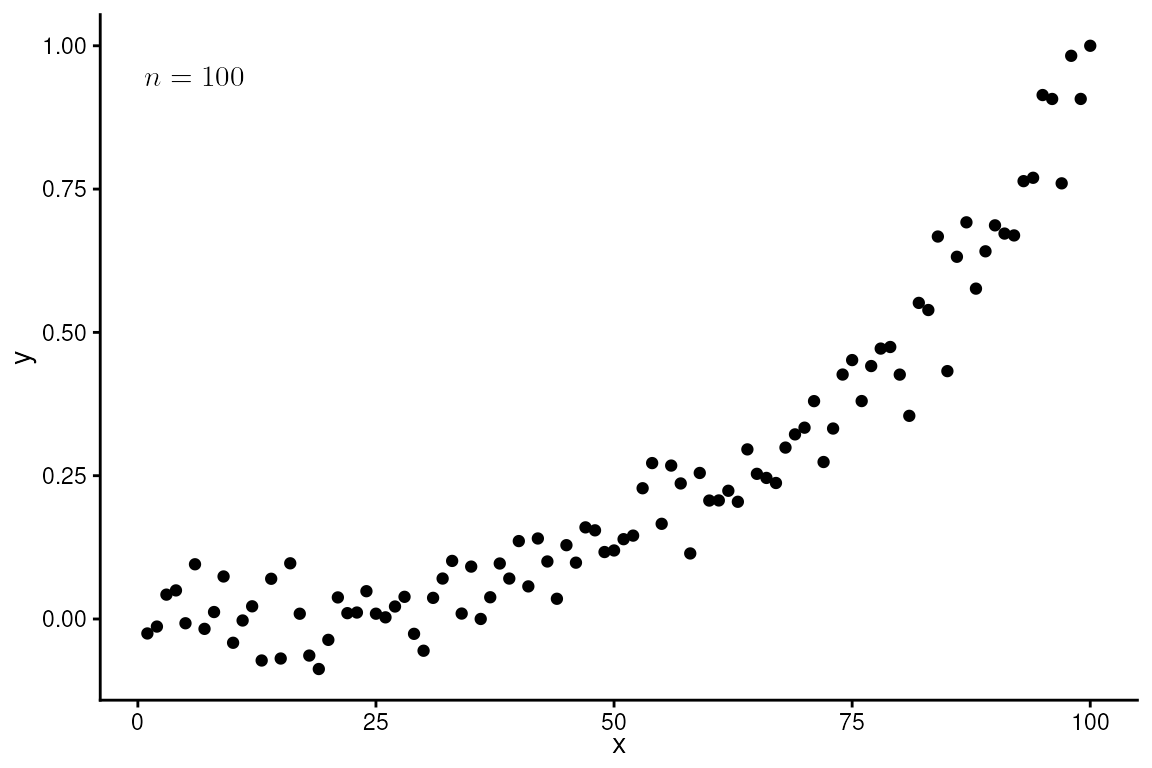
We can, of course, just format the labels using R’s functions.
ggplot(my.data[sample(1:nrow(my.data), 12), ], aes(x, y)) +
  geom_point(colour = "red", size = 0.7) +
  geom_latex(aes(label = sprintf("$ x = %.1f $", x)),
             hjust = -0.05, size = 3) +
  expand_limits(x = 110)
#> I was unable to find any missing LaTeX packages from the error log /tmp/Rtmp2hUviG/file3e5a4df53b5c.log.
#> I was unable to find any missing LaTeX packages from the error log /tmp/Rtmp2hUviG/file3e5a4df53b5c.log.
#> I was unable to find any missing LaTeX packages from the error log /tmp/Rtmp2hUviG/file3e5a2a9d3401.log.
#> I was unable to find any missing LaTeX packages from the error log /tmp/Rtmp2hUviG/file3e5a2a9d3401.log.
#> I was unable to find any missing LaTeX packages from the error log /tmp/Rtmp2hUviG/file3e5a3bd07782.log.
#> I was unable to find any missing LaTeX packages from the error log /tmp/Rtmp2hUviG/file3e5a3bd07782.log.
#> I was unable to find any missing LaTeX packages from the error log /tmp/Rtmp2hUviG/file3e5a3a29bd01.log.
#> I was unable to find any missing LaTeX packages from the error log /tmp/Rtmp2hUviG/file3e5a3a29bd01.log.
#> I was unable to find any missing LaTeX packages from the error log /tmp/Rtmp2hUviG/file3e5a73130e29.log.
#> I was unable to find any missing LaTeX packages from the error log /tmp/Rtmp2hUviG/file3e5a73130e29.log.
#> I was unable to find any missing LaTeX packages from the error log /tmp/Rtmp2hUviG/file3e5a52105f0d.log.
#> I was unable to find any missing LaTeX packages from the error log /tmp/Rtmp2hUviG/file3e5a52105f0d.log.
#> I was unable to find any missing LaTeX packages from the error log /tmp/Rtmp2hUviG/file3e5a3ef528d2.log.
#> I was unable to find any missing LaTeX packages from the error log /tmp/Rtmp2hUviG/file3e5a3ef528d2.log.
#> I was unable to find any missing LaTeX packages from the error log /tmp/Rtmp2hUviG/file3e5a7f3cfac8.log.
#> I was unable to find any missing LaTeX packages from the error log /tmp/Rtmp2hUviG/file3e5a7f3cfac8.log.
#> I was unable to find any missing LaTeX packages from the error log /tmp/Rtmp2hUviG/file3e5a15dcf30d.log.
#> I was unable to find any missing LaTeX packages from the error log /tmp/Rtmp2hUviG/file3e5a15dcf30d.log.
#> I was unable to find any missing LaTeX packages from the error log /tmp/Rtmp2hUviG/file3e5a3a09b10.log.
#> I was unable to find any missing LaTeX packages from the error log /tmp/Rtmp2hUviG/file3e5a3a09b10.log.
#> I was unable to find any missing LaTeX packages from the error log /tmp/Rtmp2hUviG/file3e5a64e50ba3.log.
#> I was unable to find any missing LaTeX packages from the error log /tmp/Rtmp2hUviG/file3e5a64e50ba3.log.
#> I was unable to find any missing LaTeX packages from the error log /tmp/Rtmp2hUviG/file3e5a7339c4e0.log.
#> I was unable to find any missing LaTeX packages from the error log /tmp/Rtmp2hUviG/file3e5a7339c4e0.log.
#> I was unable to find any missing LaTeX packages from the error log /tmp/Rtmp2hUviG/file3e5a681226fb.log.
#> I was unable to find any missing LaTeX packages from the error log /tmp/Rtmp2hUviG/file3e5a681226fb.log.
#> I was unable to find any missing LaTeX packages from the error log /tmp/Rtmp2hUviG/file3e5a2f6860a3.log.
#> I was unable to find any missing LaTeX packages from the error log /tmp/Rtmp2hUviG/file3e5a2f6860a3.log.
#> I was unable to find any missing LaTeX packages from the error log /tmp/Rtmp2hUviG/file3e5a776c3d11.log.
#> I was unable to find any missing LaTeX packages from the error log /tmp/Rtmp2hUviG/file3e5a776c3d11.log.
#> I was unable to find any missing LaTeX packages from the error log /tmp/Rtmp2hUviG/file3e5a2b9ca4a.log.
#> I was unable to find any missing LaTeX packages from the error log /tmp/Rtmp2hUviG/file3e5a2b9ca4a.log.
#> I was unable to find any missing LaTeX packages from the error log /tmp/Rtmp2hUviG/file3e5a5edef114.log.
#> I was unable to find any missing LaTeX packages from the error log /tmp/Rtmp2hUviG/file3e5a5edef114.log.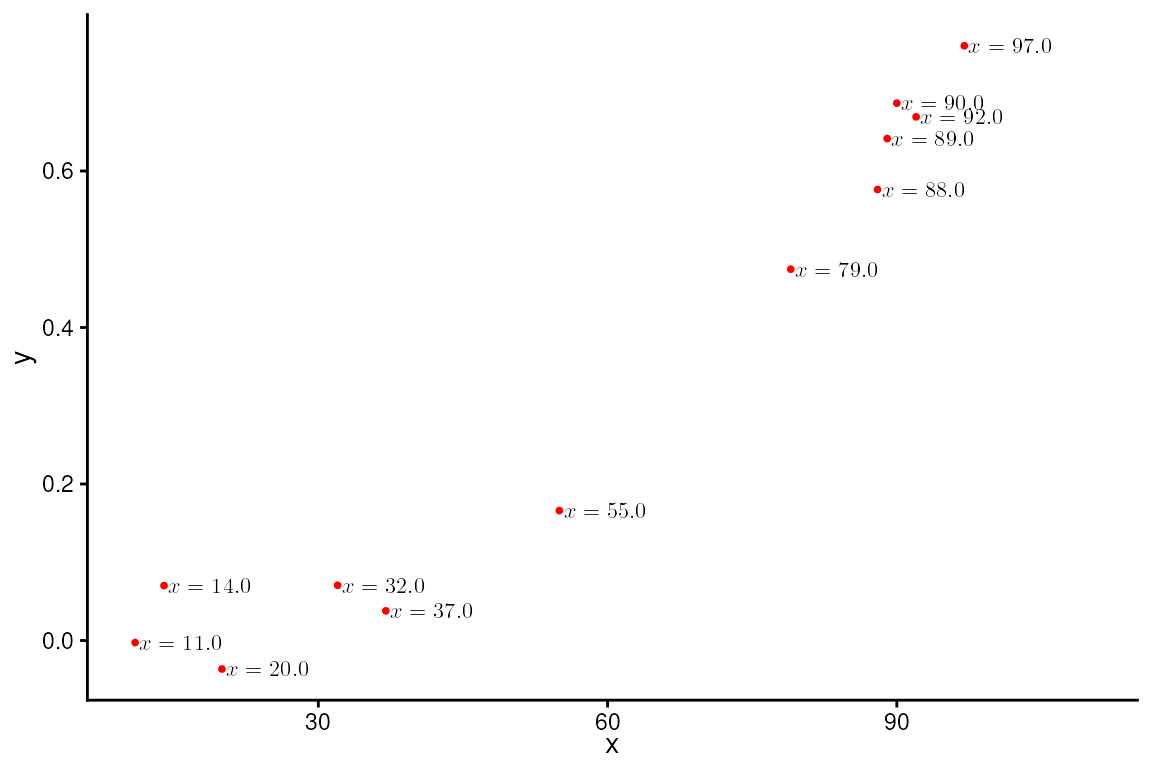
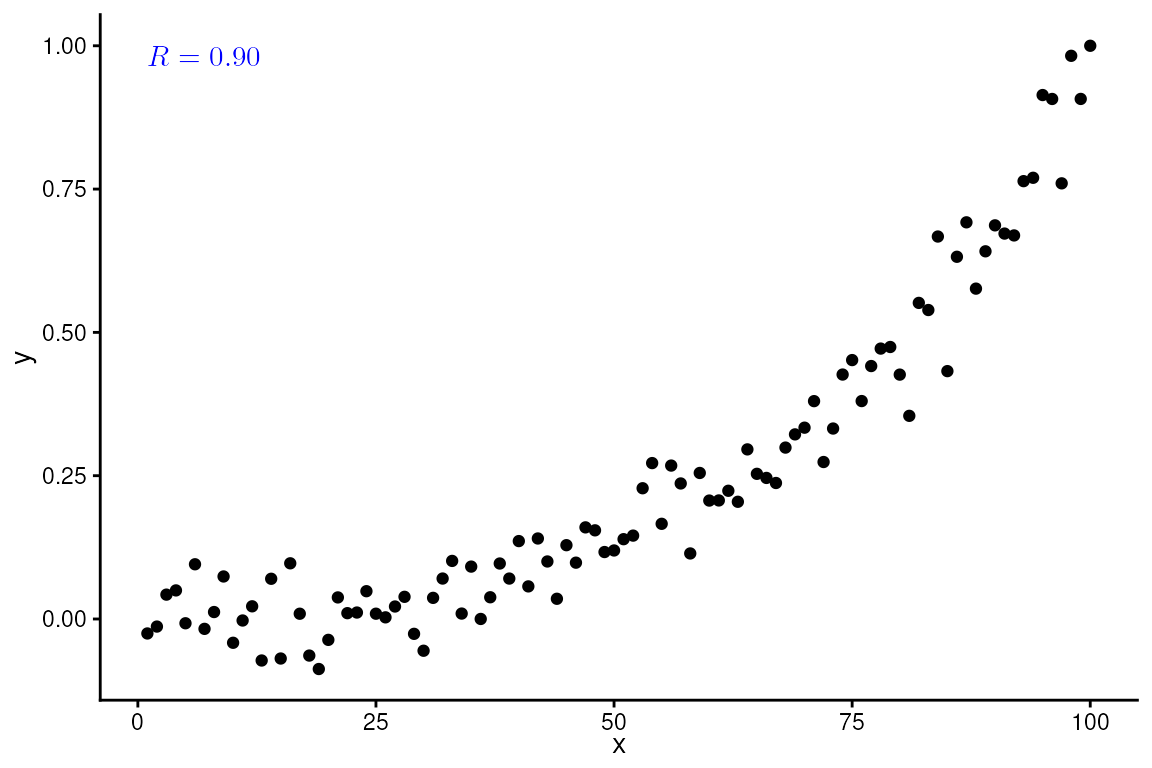
Geom element of theme
Currently, for GeomLatex from ‘xdvir’ to obey ‘ggplot2’
(>= 4.0.0) theme’s geom element, it needs to be updated using
update_geom_defaults() from ‘ggplot2’.
update_geom_defaults(
        GeomLatex,
        ggplot2::aes(colour = from_theme(colour %||% ink),
                     family = from_theme(family),
                     size = from_theme(fontsize)))
update_theme(geom.latex = element_geom(colour = "blue"))

ggplot(my.data, aes(x, y)) +
  geom_point() +
  stat_correlation(geom = "latex", hjust = 0, vjust = 1)
#> I was unable to find any missing LaTeX packages from the error log /tmp/Rtmp2hUviG/file3e5a69521e1b.log.
#> I was unable to find any missing LaTeX packages from the error log /tmp/Rtmp2hUviG/file3e5a69521e1b.log.