Annotate figures including: i) ggplots, ii) arranged ggplots from
ggarrange(), grid.arrange() and
plot_grid().
Usage
annotate_figure(
  p,
  top = NULL,
  bottom = NULL,
  left = NULL,
  right = NULL,
  fig.lab = NULL,
  fig.lab.pos = c("top.left", "top", "top.right", "bottom.left", "bottom",
    "bottom.right"),
  fig.lab.size,
  fig.lab.face,
  column.titles = NULL,
  row.titles = NULL
)
Arguments
- p
(arranged) ggplots.
- top, bottom, left, right
optional string, or grob.
- fig.lab
figure label (e.g.: "Figure 1").
- fig.lab.pos
position of the figure label, can be one of "top.left", "top", "top.right", "bottom.left", "bottom", "bottom.right". Default is "top.left".
- fig.lab.size
optional size of the figure label.
- fig.lab.face
optional font face of the figure label. Allowed values include: "plain", "bold", "italic", "bold.italic".
- column.titles, row.titles
optional character vector giving one title per column / per row of the arranged figure, adding titles above each column and to the left of each row (useful for publication grids, see
ggarrange()). Can also be a list of grobs (e.g. built withtext_grob()) for full control over styling; a character vector is rendered in bold using the current theme text settings. The titles are evenly spaced and therefore assume equal-sized columns / rows (theggarrange()default), with one entry per column / row.row.titlesare rotated 90 degrees.
Author
Laszlo Erdey erdey.laszlo@econ.unideb.hu
Examples
data("ToothGrowth")
df <- ToothGrowth
df$dose <- as.factor(df$dose)
# Create some plots
# ::::::::::::::::::::::::::::::::::::::::::::::::::
# Box plot
bxp <- ggboxplot(df,
x = "dose", y = "len",
color = "dose", palette = "jco"
)
# Dot plot
dp <- ggdotplot(df,
x = "dose", y = "len",
color = "dose", palette = "jco"
)
# Density plot
dens <- ggdensity(df, x = "len", fill = "dose", palette = "jco")
# Arrange and annotate
# ::::::::::::::::::::::::::::::::::::::::::::::::::
figure <- ggarrange(bxp, dp, dens, ncol = 2, nrow = 2)
#> Bin width defaults to 1/30 of the range of the data. Pick better value with
#> `binwidth`.
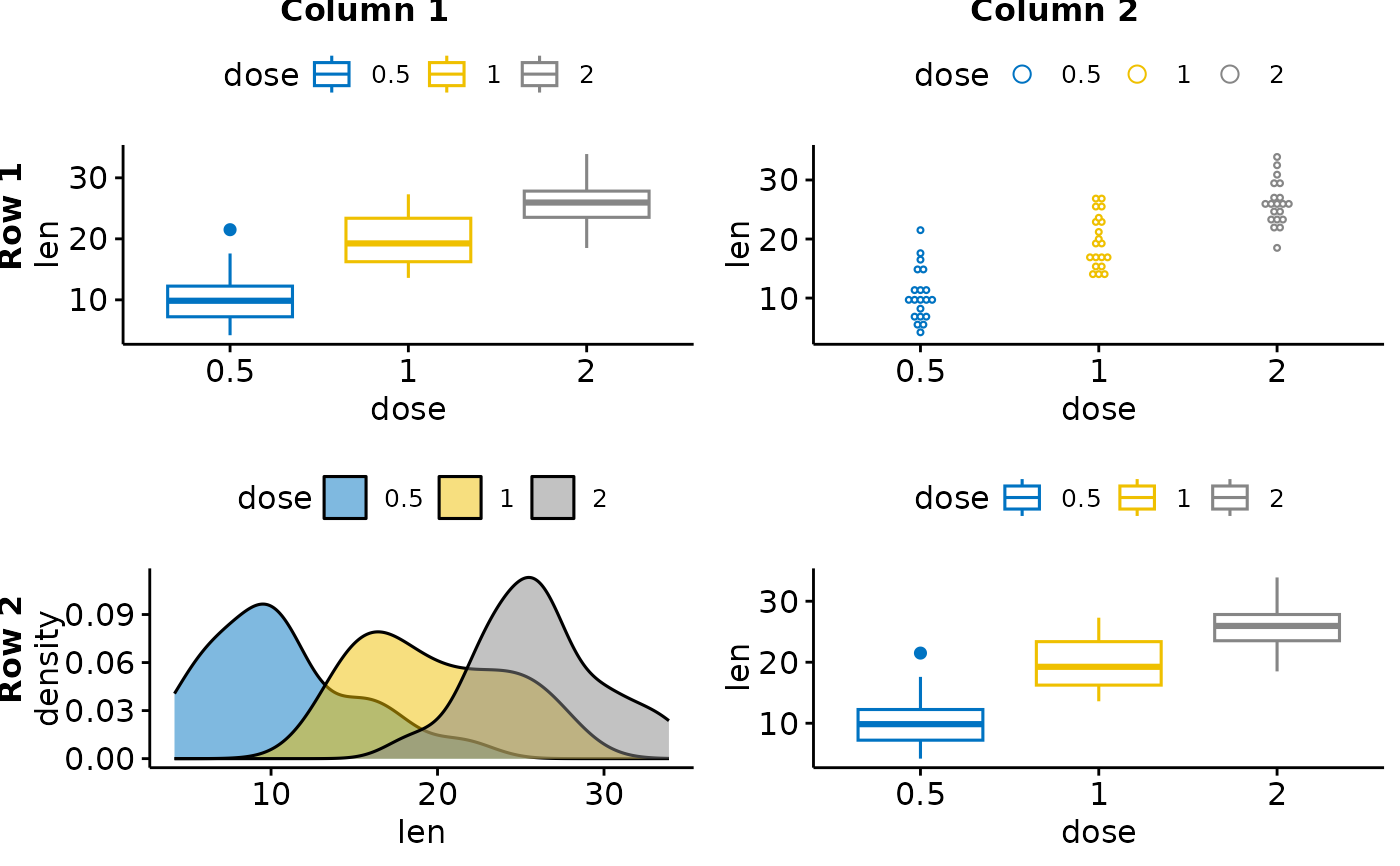
annotate_figure(figure,
top = text_grob("Visualizing Tooth Growth", color = "red", face = "bold", size = 14),
bottom = text_grob("Data source: \n ToothGrowth data set",
color = "blue",
hjust = 1, x = 1, face = "italic", size = 10
),
left = text_grob("Figure arranged using ggpubr", color = "green", rot = 90),
right = text_grob(bquote("Superscript: (" * kg ~ NH[3] ~ ha^-1 ~ yr^-1 * ")"), rot = 90),
fig.lab = "Figure 1", fig.lab.face = "bold"
)
 # Add a title to each column and each row of an arranged grid
# ::::::::::::::::::::::::::::::::::::::::::::::::::
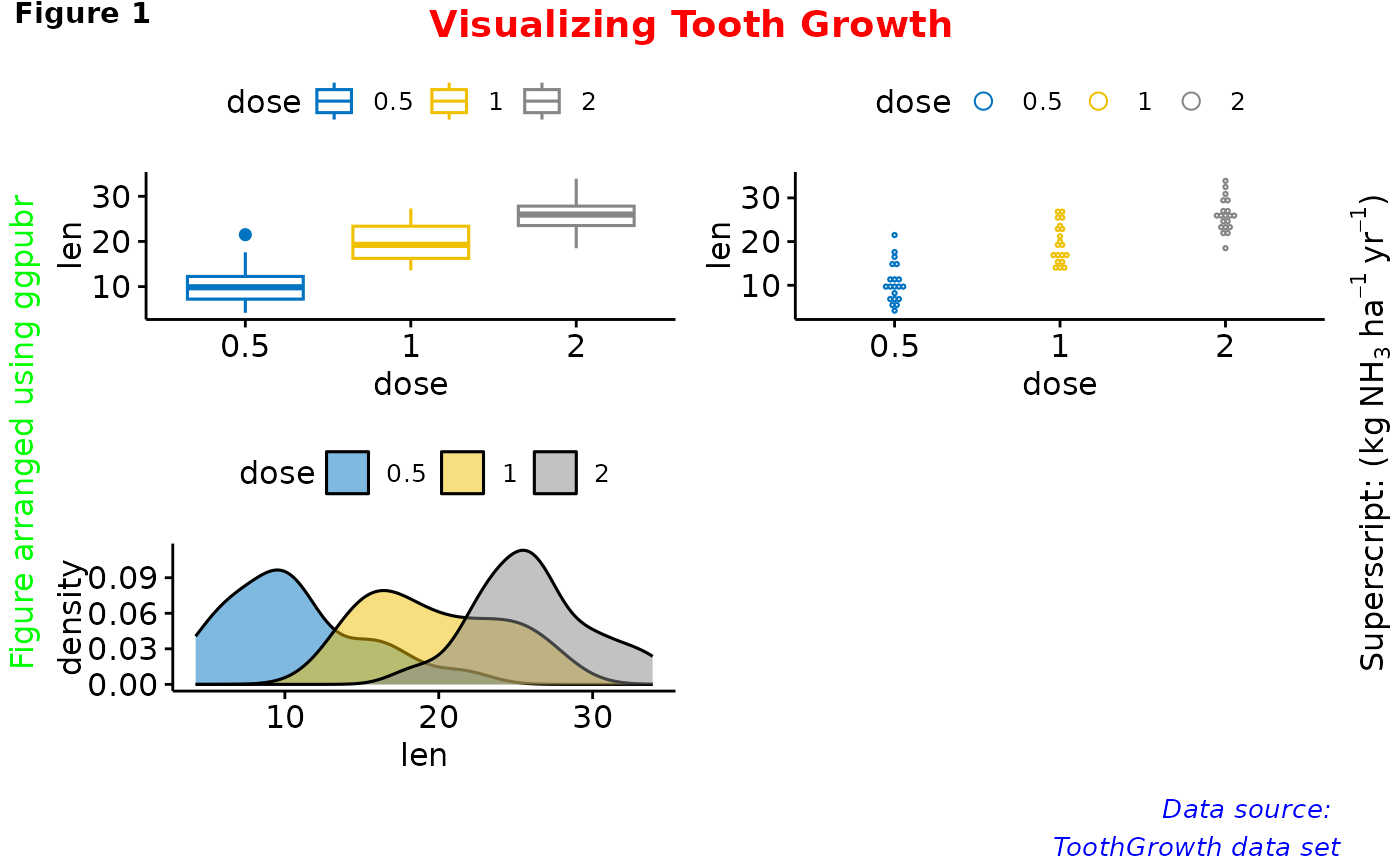
grid <- ggarrange(bxp, dp, dens, bxp, ncol = 2, nrow = 2)
#> Bin width defaults to 1/30 of the range of the data. Pick better value with
#> `binwidth`.
annotate_figure(grid,
column.titles = c("Column 1", "Column 2"),
row.titles = c("Row 1", "Row 2")
)
# Add a title to each column and each row of an arranged grid
# ::::::::::::::::::::::::::::::::::::::::::::::::::
grid <- ggarrange(bxp, dp, dens, bxp, ncol = 2, nrow = 2)
#> Bin width defaults to 1/30 of the range of the data. Pick better value with
#> `binwidth`.
annotate_figure(grid,
column.titles = c("Column 1", "Column 2"),
row.titles = c("Row 1", "Row 2")
)