Plot a quantile regression line with standard error bounds.
panel.quantile.RdPlot a quantile regression line with standard error bounds, using the
quantreg package. This is based on the
stat_quantile function from ggplot2.
panel.quantile(x, y, form = y ~ x, method = "rq", ...,
    tau = 0.5, ci = FALSE, ci.type = "default", level = 0.95,
    n = 100, col = plot.line$col, col.se = col,
    lty = plot.line$lty, lwd = plot.line$lwd,
    alpha = plot.line$alpha, alpha.se = 0.25, border = NA,
    superpose = FALSE,
    ## ignored: ##
    subscripts, group.number, group.value,
    type, col.line, col.symbol, fill,
    pch, cex, font, fontface, fontfamily)
Arguments
- x, y
data points. If these are missing, they will be looked for in the environment of
form. So in many cases you can skip these if passingform. In fact, for convenience, the formula can be passed as the first argument (i.e.x).- form, method
Formula and the name of a modeling function (as a character string). The model is constructed (approximately) as
method(form, tau = tau, data = list(x=x, y=y), ...). Currently,methodis expected to be either"rq"or"rqss", and for these the corresponding functions in the quantreg package is used. In principle, any other function that supports the same interface can also be specified by name.- ...
further arguments passed on to the model function (
method), typicallyrq.- tau
p values for the quantiles to estimate.
Note: only one value for
taucan be specified if estimating confidence intervals withci.- ci, ci.type, level
estimate a confidence interval at level
levelusing the methodci.type; seepredict.rq.- n
number of equi-spaced points on which to evaluate the function.
- col, col.se, lty, lwd, alpha, alpha.se, border
graphical parameters.
colandalphaapply to the line(s), whilecol.seandalpha.seapply to the shadedciregion.- superpose
if
TRUE, plot each quantile line (tau) in a different style (usingtrellis.par.get("superpose.line")).- subscripts, group.number, group.value, type, col.line, col.symbol, fill, pch, cex, font, fontface, fontfamily
ignored.
Details
It is recommended to look at vignette("rq", package="quantreg").
See also
rq,
panel.smoother,
stat_quantile
Examples
## library("quantreg")
set.seed(1)
xy <- data.frame(x = runif(100), y = rt(100, df = 5))
xyplot(y ~ x, xy) +
layer(panel.quantile(x, y, tau = c(.95, .5, .05)))
 if (require("splines")) {
xyplot(y ~ x, xy) +
layer(panel.quantile(y ~ ns(x, 3), tau = 0.9))
xyplot(y ~ x, xy) +
layer(panel.quantile(y ~ ns(x, 3), tau = 0.9, ci = TRUE))
}
#> Loading required package: splines
if (require("splines")) {
xyplot(y ~ x, xy) +
layer(panel.quantile(y ~ ns(x, 3), tau = 0.9))
xyplot(y ~ x, xy) +
layer(panel.quantile(y ~ ns(x, 3), tau = 0.9, ci = TRUE))
}
#> Loading required package: splines
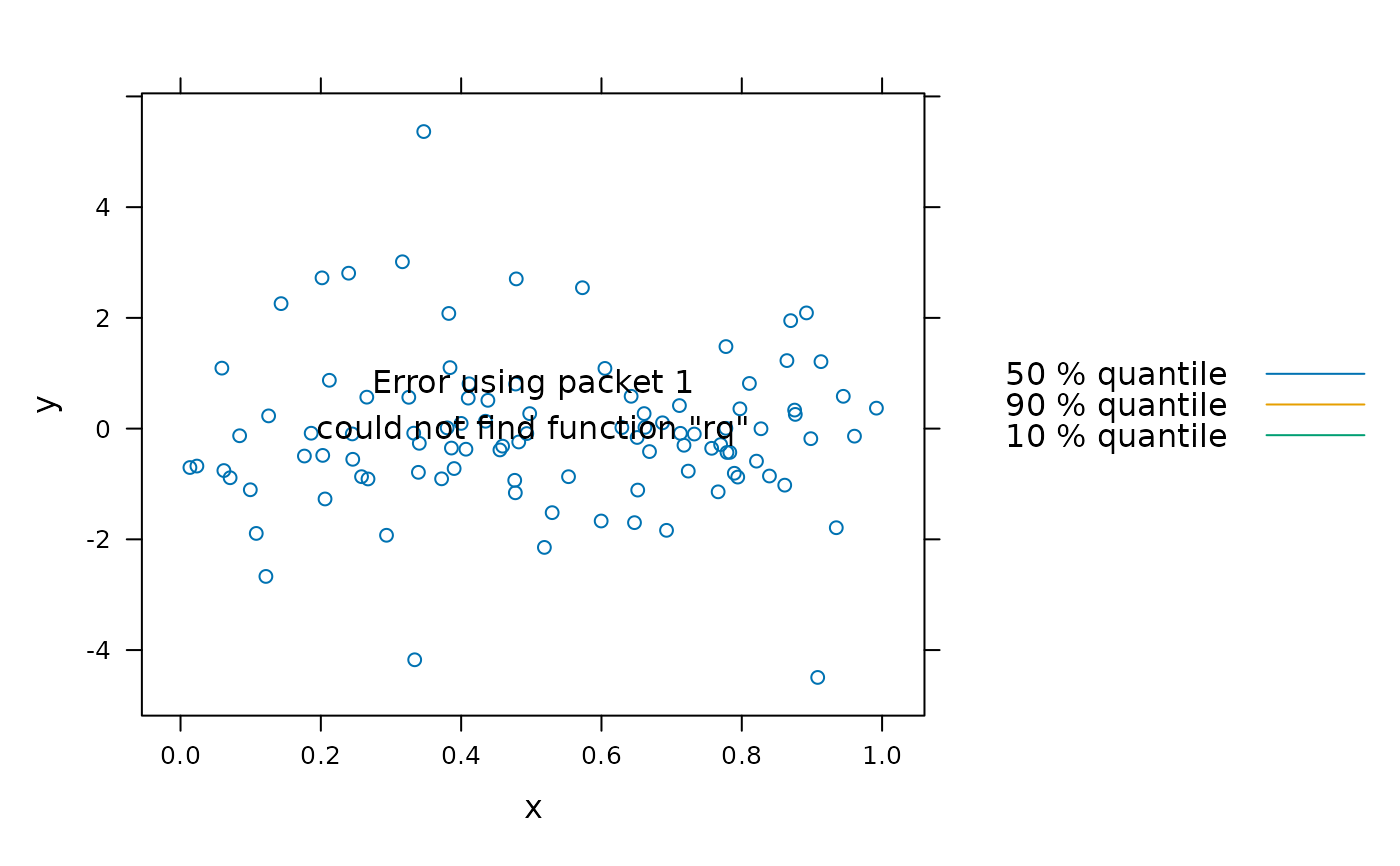
 xyplot(y ~ x, xy) +
layer(panel.quantile(x, y, tau = c(.5, .9, .1), superpose = TRUE))
xyplot(y ~ x, xy) +
layer(panel.quantile(x, y, tau = c(.5, .9, .1), superpose = TRUE))
 update(trellis.last.object(),
auto.key = list(text = paste(c(50,90,10), "% quantile"),
points = FALSE, lines = TRUE))
update(trellis.last.object(),
auto.key = list(text = paste(c(50,90,10), "% quantile"),
points = FALSE, lines = TRUE))
 xyplot(y ~ x, xy) +
layer(panel.quantile(y ~ qss(x, lambda=1), method = "rqss"))
xyplot(y ~ x, xy) +
layer(panel.quantile(y ~ qss(x, lambda=1), method = "rqss"))