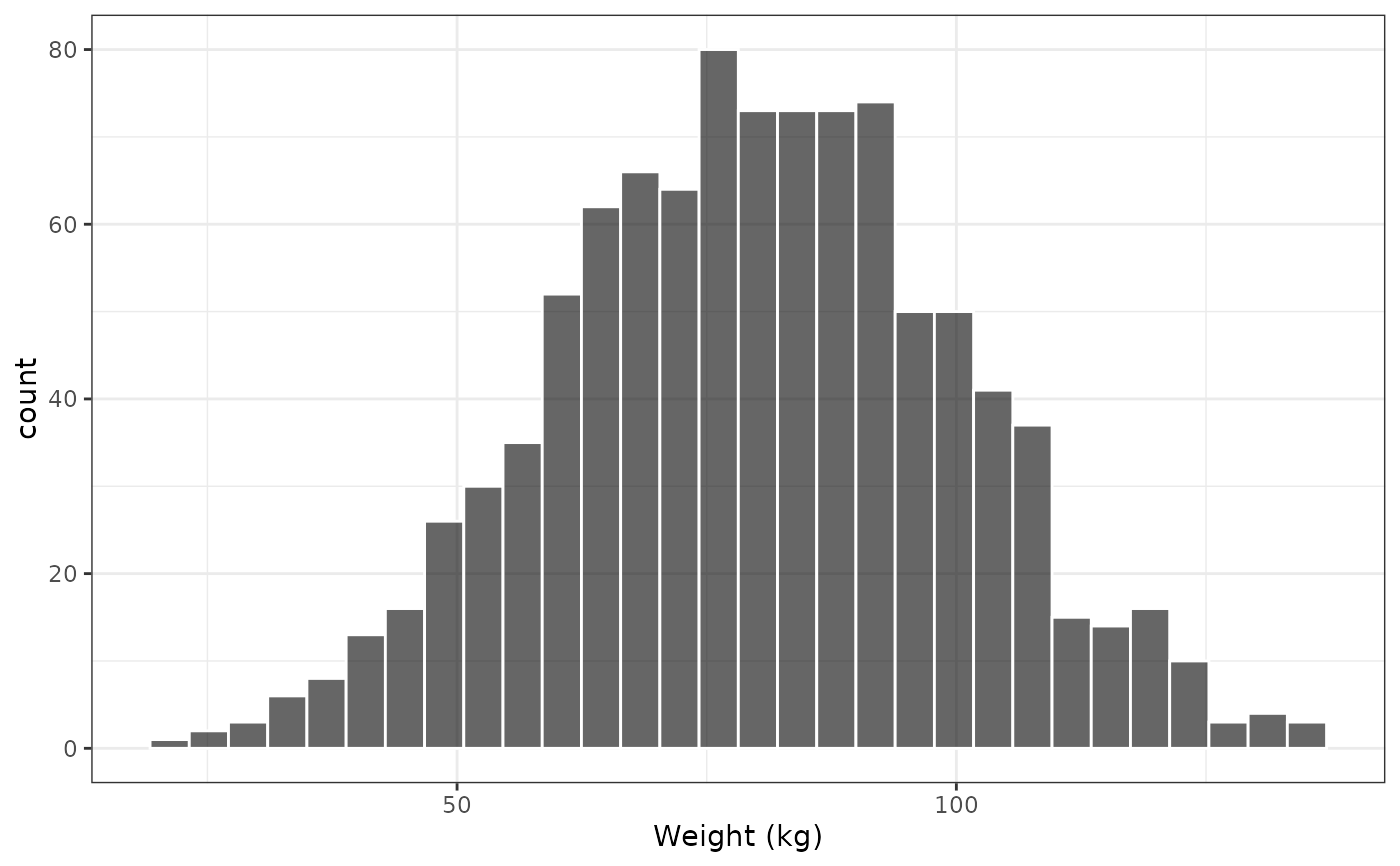
cont_hist_list is a vectorized version
of cont_hist. pm_histogram is a generic histogram
function that is called by other functions in pmplots.
Usage
cont_hist(
  df,
  x,
  xs = defx(),
  y = "count",
  add_density = y == "density",
  add_layers = TRUE,
  ...
)

cont_hist_list(df, x, ...)

pm_histogram(
  ...,
  col = opts$histogram.col,
  fill = opts$histogram.fill,
  alpha = opts$histogram.alpha
)
Arguments
- df
the data frame containing plotting data.
- x
the x column for
ggplot2::geom_histogram().- xs
a list of information for the x axis.
- y
what to use for the y-axis on the histogram; can be
"count"or"density".- add_density
if
TRUE, a normal density line will be plotted over the histogram usingadd_density().- add_layers
extra layers will be added only if
TRUE.- ...
passed to
ggplot2::geom_histogram()andadd_density().- col
a character value passed to
ggplot2::geom_histogram().- fill
a character value passed to
ggplot2::geom_histogram().- alpha
a numeric value passed to
ggplot2::geom_histogram().
Examples
data <- data.frame(WT = rnorm(1000,80,20))

cont_hist(data, x = "WT//Weight (kg)")
#> `stat_bin()` using `bins = 30`. Pick better value `binwidth`.