
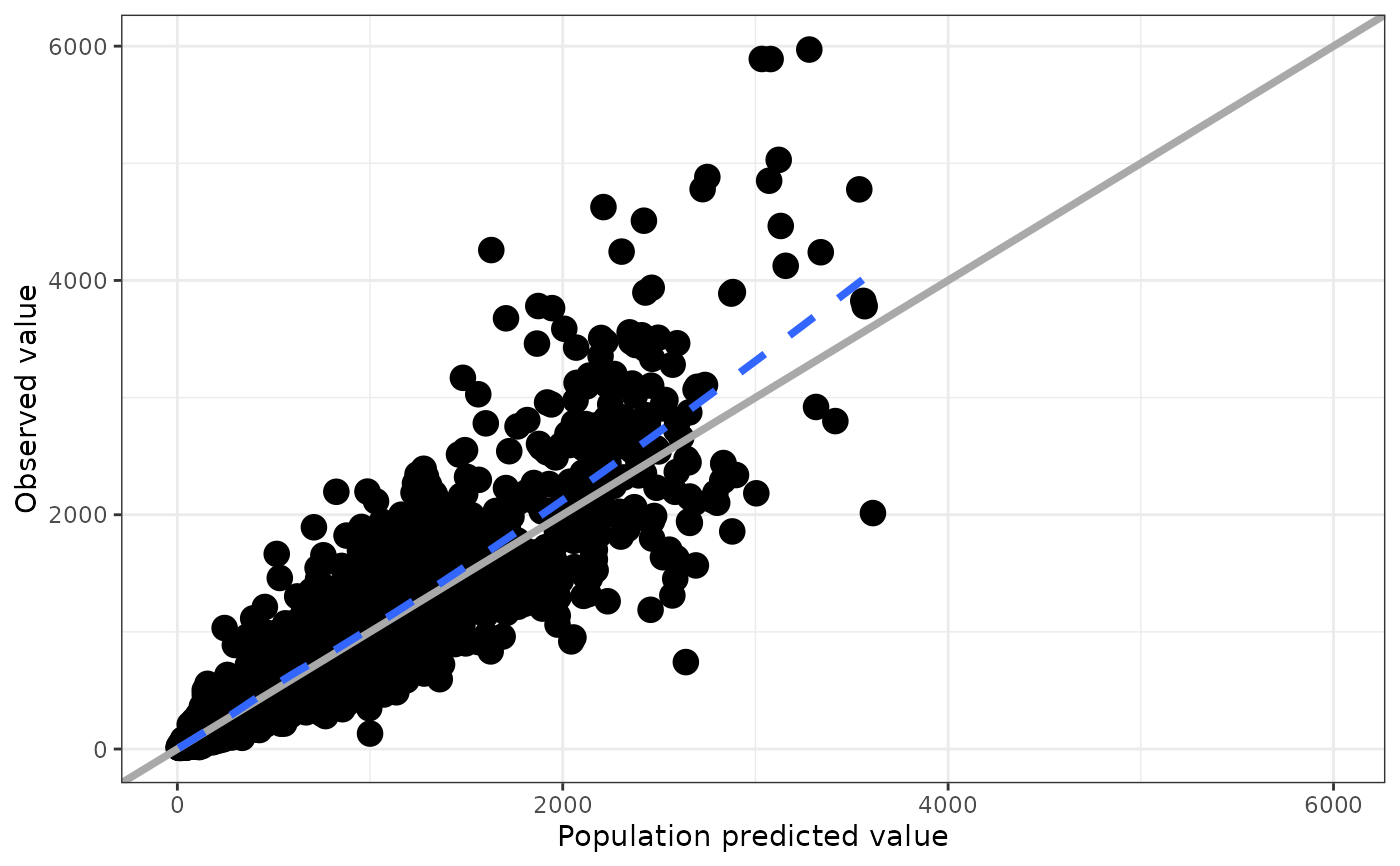
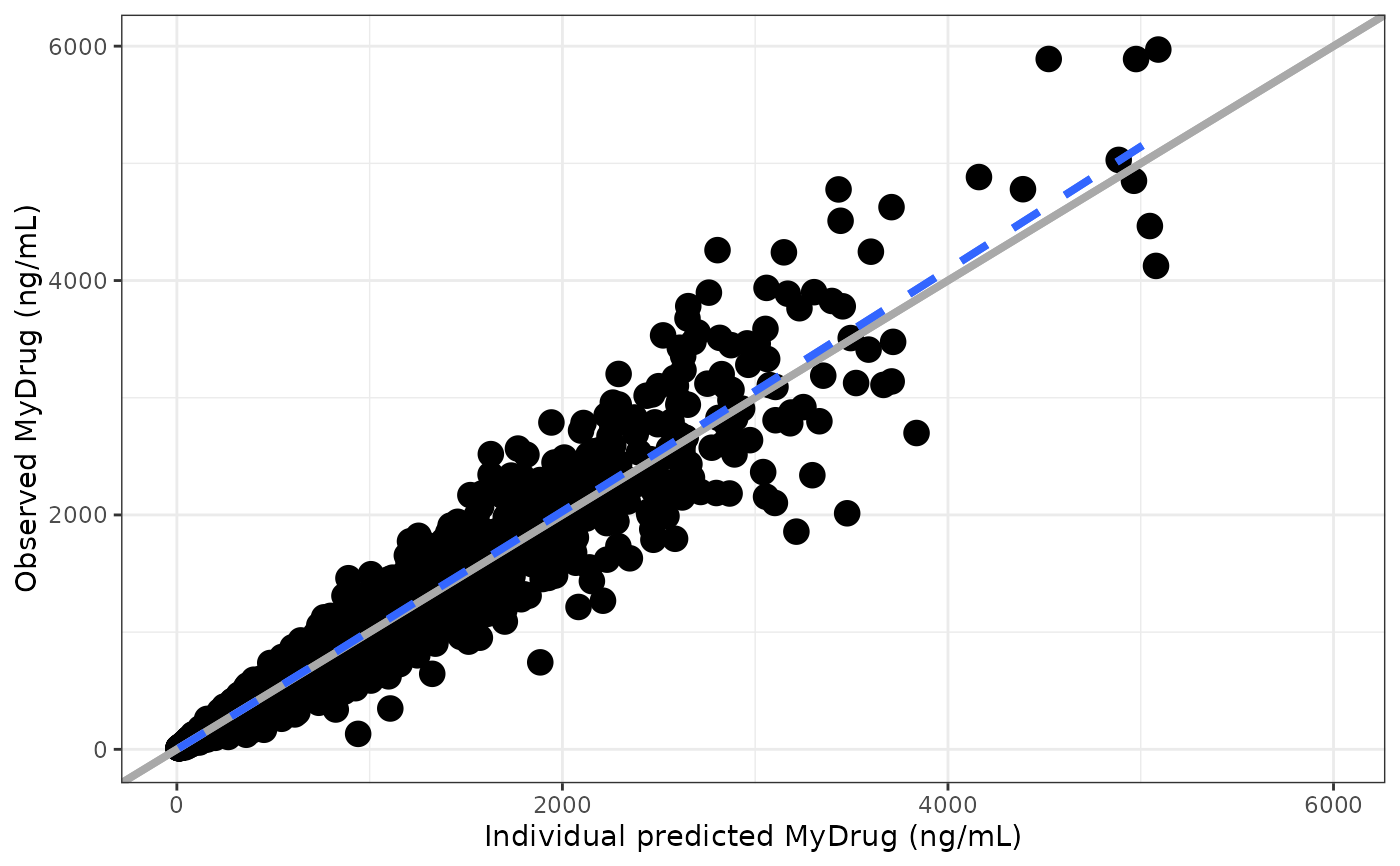
Plots for DV versus population or individual predicted values. dv_preds
makes both plots and returns them as a list (more in details).
Usage
dv_pred(
  df,
  x = pm_axis_pred(),
  y = pm_axis_dv(),
  yname = "value",
  xname = "value",
  ys = list(),
  xs = ys,
  loglog = FALSE,
  scales = c("fixed", "free", "null"),
  logbr = c("full", "half", "null"),
  ...
)

dv_ipred(df, x = pm_axis_ipred(), ...)

dv_preds(df, ...)
Arguments
- df
data frame to plot
- x
character name for x-axis data
- y
character name for y-axis data
- yname
used to form y-axis label
- xname
used to form x-axis label
- ys
see
defy()- xs
see
defx(); note thatxsdefaults toysso (by default) the scale configuration will be identical; pass bothxsandysto have them independently configured- loglog
if
TRUE, x- and y-axes will be log-transformed- scales
if
TRUE, then the x- and y- axes will be forced to have the same limits- logbr
when using log scale, should the tick marks be at
full-log intervals orhalf-log intervals? If you passnull, the default scales will be used (which might be identical tofull). Usexsandysto pass custom scales.- ...
passed to
scatt()andlayer_as()
Details
Since this function creates a scatter plot, both the x and y columns
must be numeric.
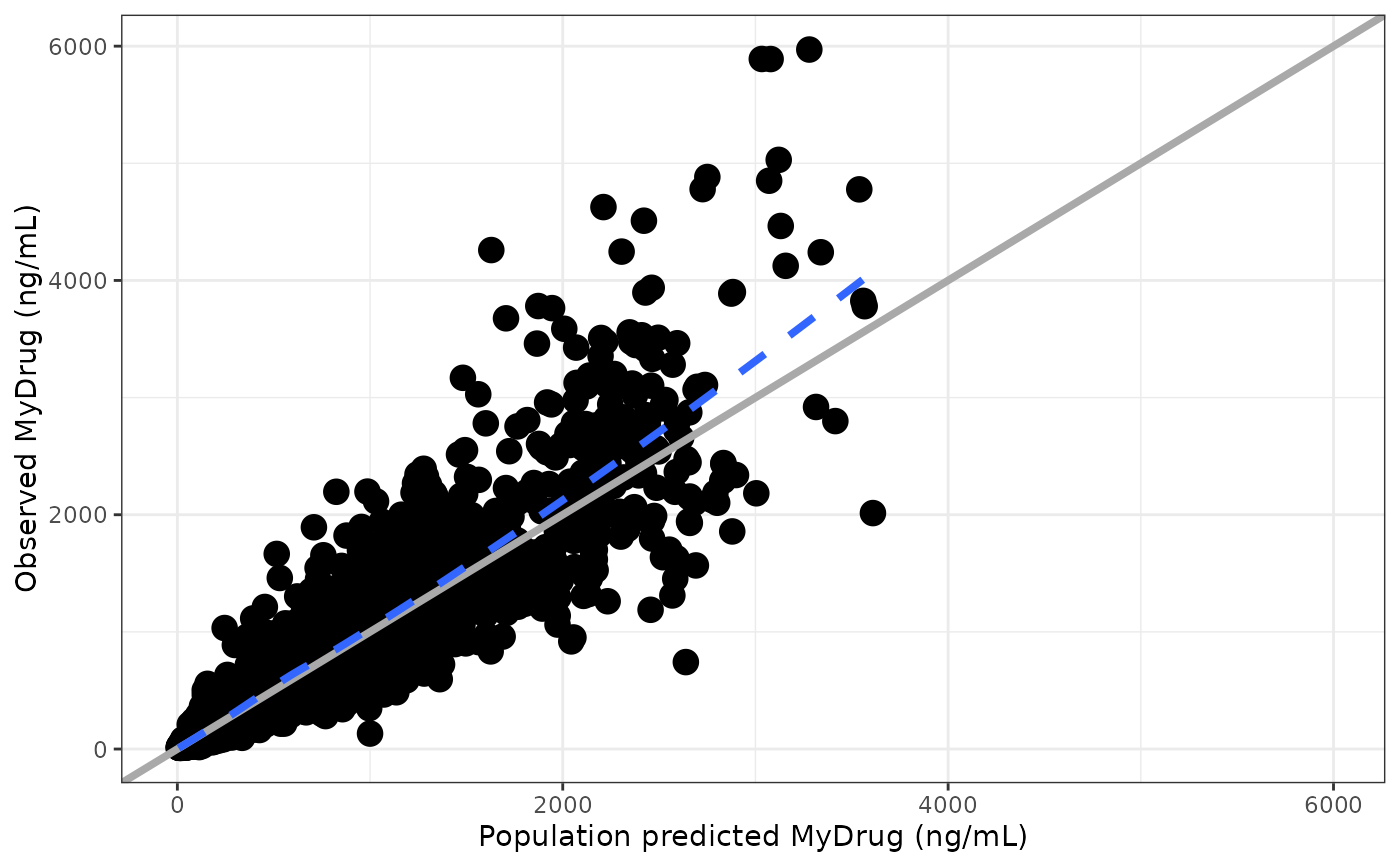
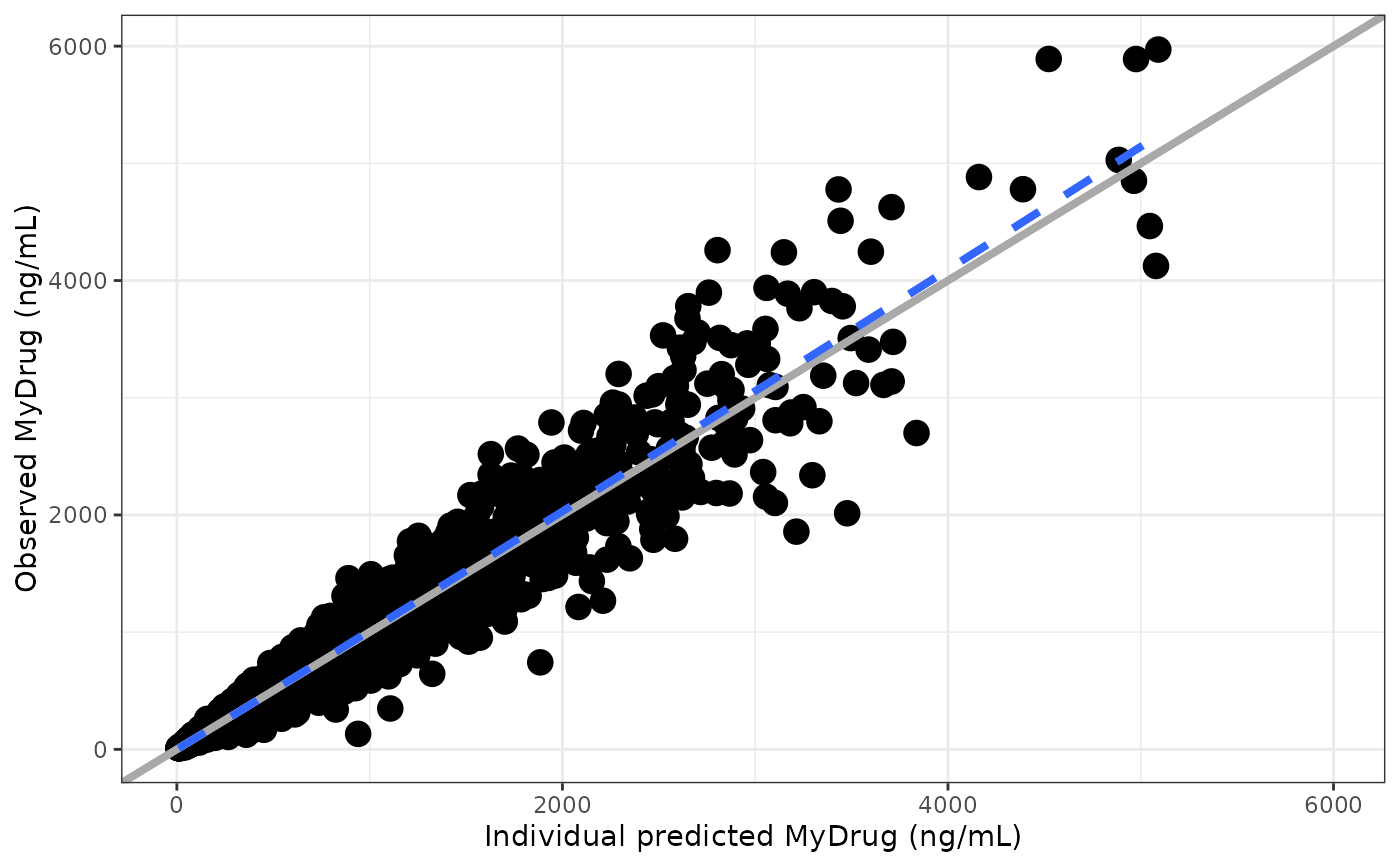
dv_preds returns a list of two plots, with the result of dv_pred in the
first position and the result of dv_ipred in the second position. In
this case, ... are passed to both functions.
Examples
df <- pmplots_data_obs()
dv_pred(df)
#> `geom_smooth()` using formula = 'y ~ x'
 dv_ipred(df, yname="MyDrug (ng/mL)")
#> `geom_smooth()` using formula = 'y ~ x'
#> `geom_smooth()` using formula = 'y ~ x'
dv_ipred(df, yname="MyDrug (ng/mL)")
#> `geom_smooth()` using formula = 'y ~ x'
#> `geom_smooth()` using formula = 'y ~ x'
 dv_preds(df, yname = "MyDrug (ng/mL)")
#> $PRED
#> `geom_smooth()` using formula = 'y ~ x'
dv_preds(df, yname = "MyDrug (ng/mL)")
#> $PRED
#> `geom_smooth()` using formula = 'y ~ x'
 #>
#> $IPRED
#> `geom_smooth()` using formula = 'y ~ x'
#> `geom_smooth()` using formula = 'y ~ x'
#>
#> $IPRED
#> `geom_smooth()` using formula = 'y ~ x'
#> `geom_smooth()` using formula = 'y ~ x'
 #>
#>