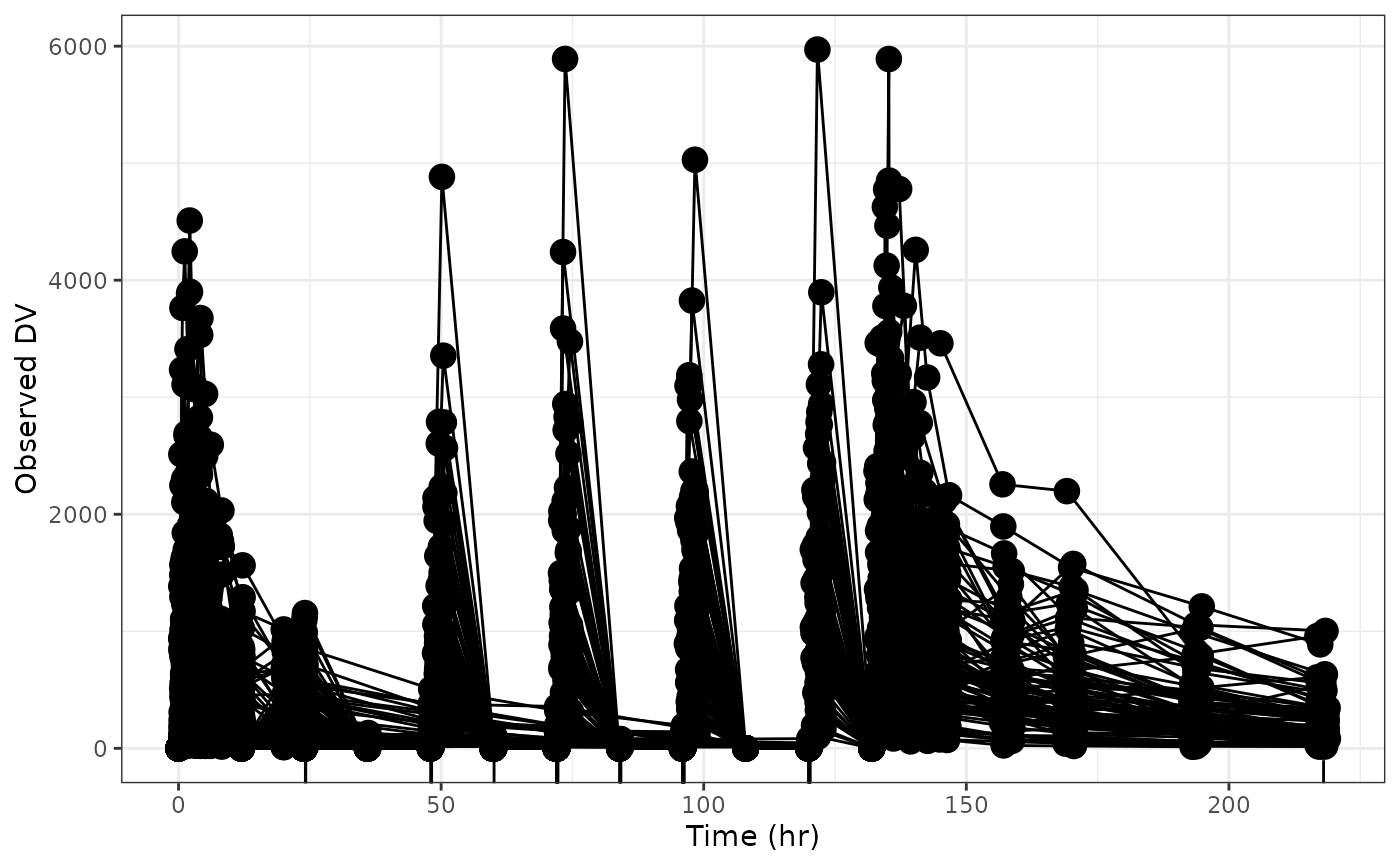
Plot DV versus time
Usage
dv_time(
  df,
  x = pm_axis_time(),
  y = pm_axis_dv(),
  xunit = opts$time.unit,
  yname = "DV",
  group = pm_col_id(),
  xs = list(),
  ys = list(),
  log = FALSE,
  xby = NULL,
  ...
)

dv_tafd(df, x = pm_axis_tafd(), ...)

dv_tad(df, x = pm_axis_tad(), ...)
Arguments
- df
data frame to plot
- x
character name for x-axis data
- y
character name for y-axis data
- xunit
time units; used to form x-axis label
- yname
used to form y-axis label
- group
passed to
scatt- xs
see
defx- ys
see
defy- log
if
TRUE, y-axis will be log-transformed- xby
interval for x-axis breaks
- ...
passed to
scatt
Details
Plots are generated using y_time,
which then calls scatt.
Since this function creates a scatter plot,
both the x and y columns must
be numeric.
If the data set includes a BLQ column,
the values in the y column are
set to NA when BLQ is
not equal to 0.
Examples
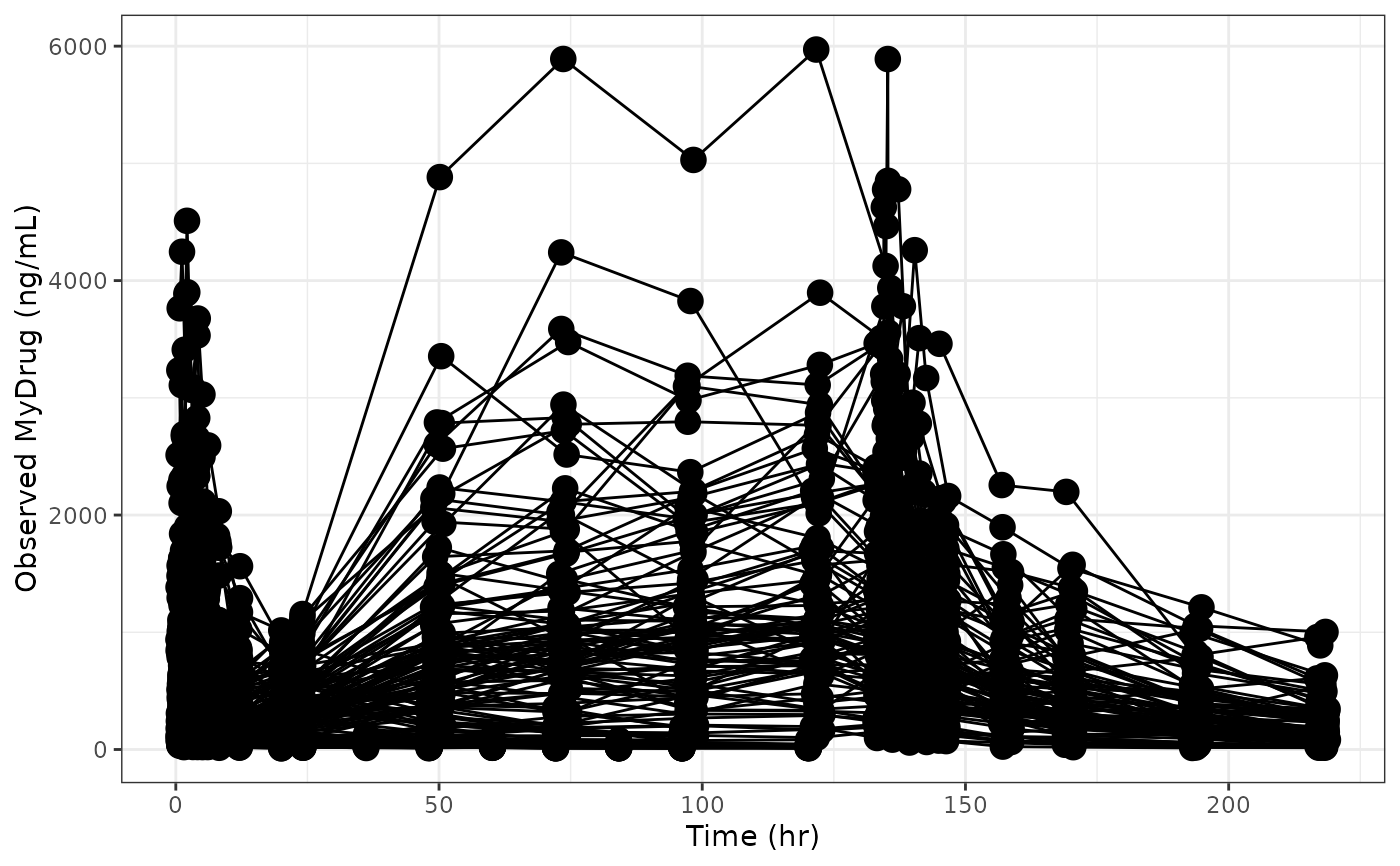
df <- pmplots_data_obs()
dv_time(df, yname="MyDrug (ng/mL)")
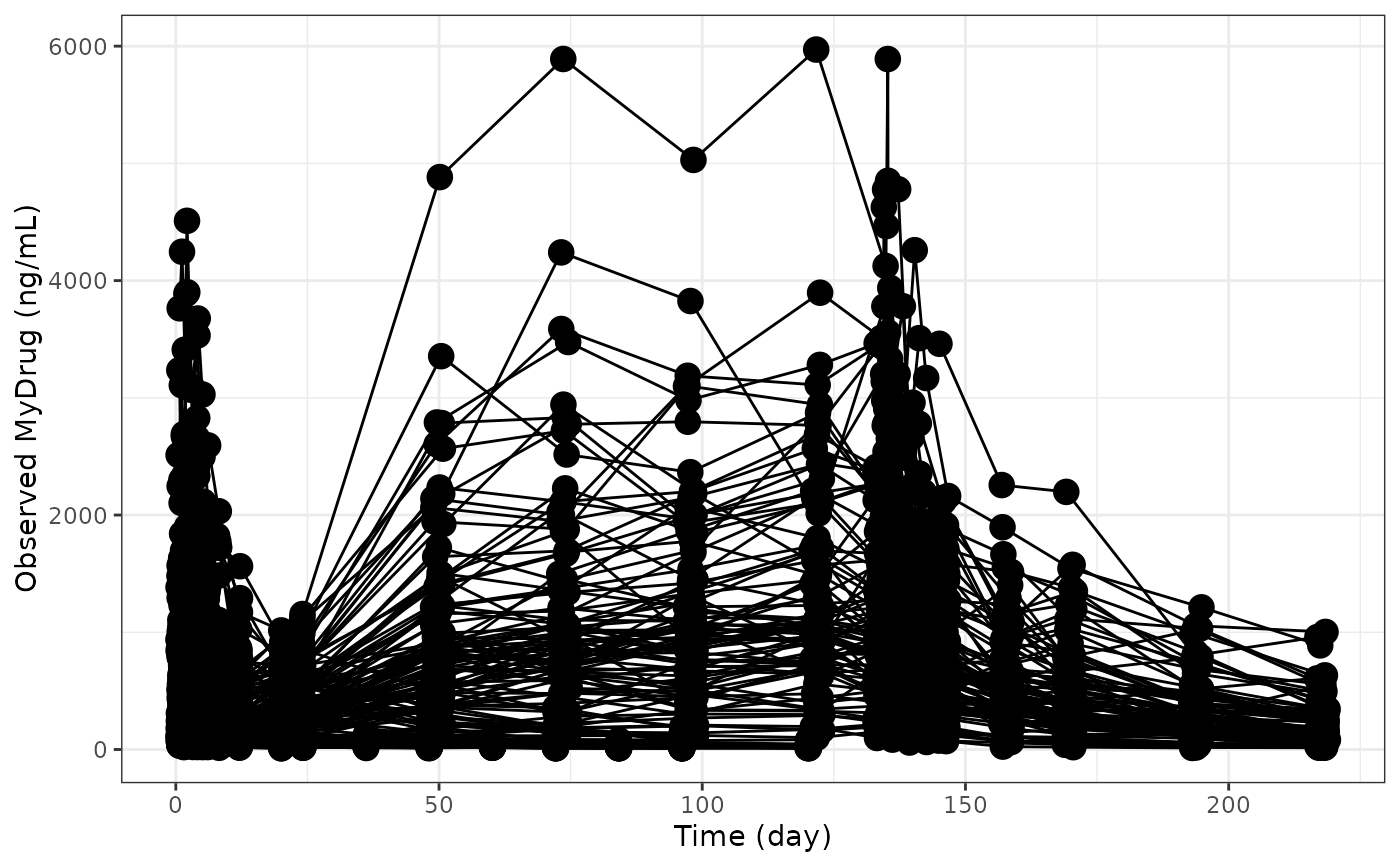
 dv_time(df, yname="MyDrug (ng/mL)", xunit="day")
 # Add a rug
df <- pmplots_data()
dv_time(df) + geom_rug(data = ~ dplyr::filter(.x,BLQ > 0))
#> Warning: Removed 68 rows containing missing values or values outside the scale range
#> (`geom_point()`).
#> Warning: Removed 68 rows containing missing values or values outside the scale range
#> (`geom_line()`).
#> Warning: Removed 68 rows containing missing values or values outside the scale range
#> (`geom_rug()`).
# Add a rug
df <- pmplots_data()
dv_time(df) + geom_rug(data = ~ dplyr::filter(.x,BLQ > 0))
#> Warning: Removed 68 rows containing missing values or values outside the scale range
#> (`geom_point()`).
#> Warning: Removed 68 rows containing missing values or values outside the scale range
#> (`geom_line()`).
#> Warning: Removed 68 rows containing missing values or values outside the scale range
#> (`geom_rug()`).