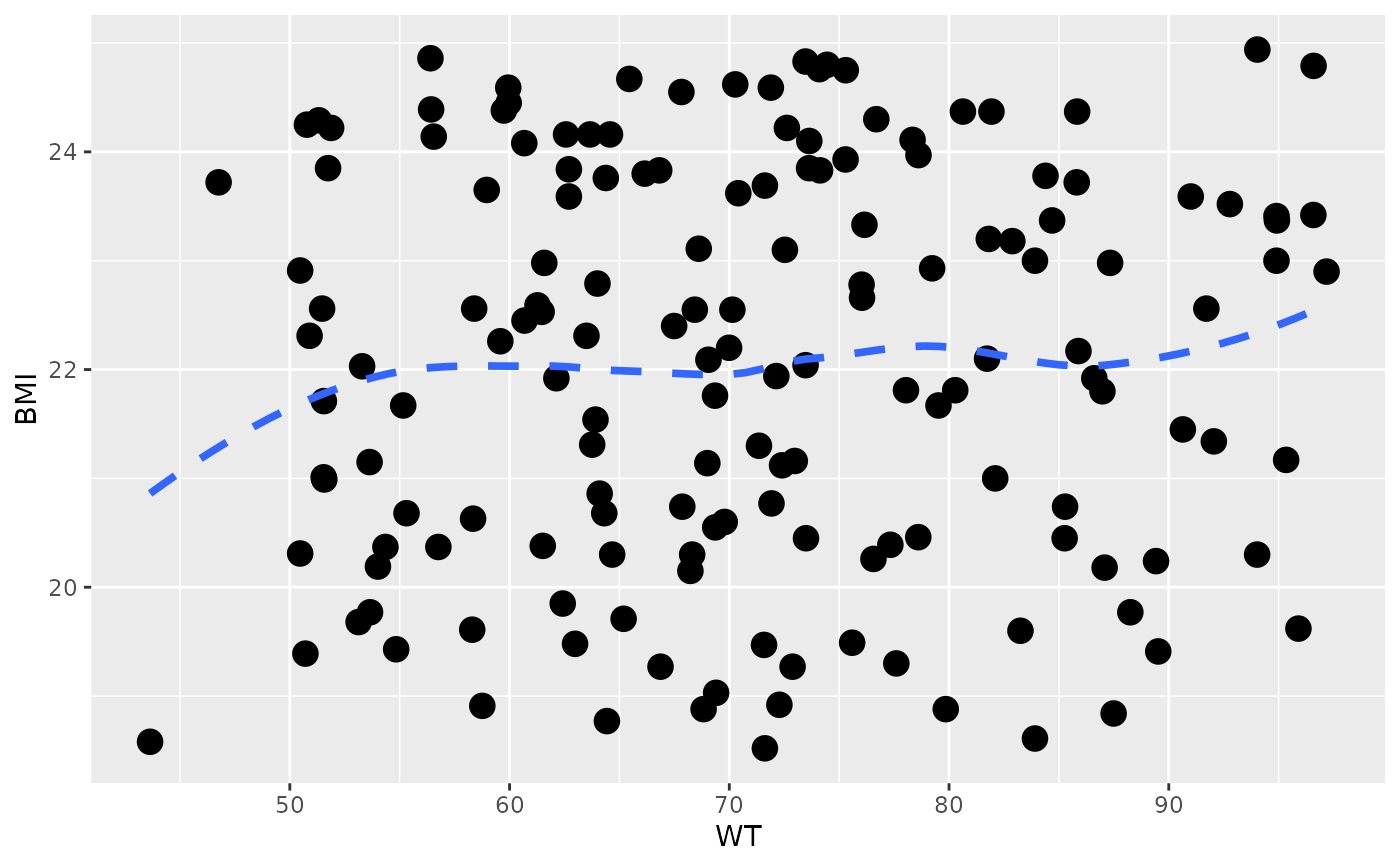
Default plots for lower triangle
Details
the function should take one argument (a
ggobject`)modify that object to render the data; this is typically using
ggplot2::geom_point()add aesthetics or layers as you would for any
ggplotworkflow
Examples
data <- pmplots_data_id()
p <- ggplot(data = data, aes(WT, BMI))
p
 pmplots:::pairs_lower_plot(p)
#> `geom_smooth()` using formula = 'y ~ x'
pmplots:::pairs_lower_plot(p)
#> `geom_smooth()` using formula = 'y ~ x'